October 2026
WELCOME
Welcome to The Crazy Plan where our mission is to show that anyone can create unimaginable wealth.
Each month, we publish a blog providing readers with the financial education needed to set out on their own journey to a bright financial future. We do this by following two plans, our Monthly Plan saves £50 a month for 10 years and our Lumpsum Plan starts with a one-off £10,000. Our aim is to turn each plan into $1 billion in one or two generations.
At first, making $1 billion seems crazy but once you realise it’s a journey then things change. We’ll save our first £50 and from there our wealth will build to $1,000, then $5,000, then $10,000 and then $50,000. One day, if we’re patient, we’ll have $100,000 and then we’ll be looking at $1 million. From there it will be onwards to our $1 billion goal. This journey of small steps is how what seems impossible becomes possible.
You can dig-in to our posts however you like or if you are completely new to investing, you may want to start with “1.0 Liftoff!” and go through them in order which is how we build the education. We hope to provide you with the knowledge needed to set out on your own journey to a bright financial future if you choose. You can also visit the “About” page on our website to learn more about our plan.
All readers must read and agree to our Terms & Conditions, including the Disclaimer, which can be found on the T&C page of our website: https://thecrazyplan.com
ON WITH THE PLAN
Our Lumpsum Plan will be worth $1billion in: 76yrs 4mths
Our Monthly Plan will be worth $1billion in: 85yrs 10mths
Please subscribe for free to receive our posts by email using the Subscribe box at the top of our website!
Last month we looked at setting up a share dealing account which is needed to buy and sell investments. The first thing we covered was platform providers and the importance of them being regulated and then we moved on to look at different types of investment account such as general accounts, tax advantaged accounts and pensions. When investing, we’re trying to maximise our net CAGR so we talked about keeping costs such as account fees, dealing fees and holding fees low and we also discussed everyone’s favourite word, tax, as it has a significant impact on our net CAGR.
This month we’re going to do our quarterly portfolio review and look at our Watchlist. We’re also going to take a look at our Wealth Ladder to see what the future might look like as it’s been a while since we last ran it. First though, it’s that time of year again…
BLACK FRIDAY, CHRISTMAS AND ALL SORTS OF EXCUSES.
For the last couple of years, we’ve reminded ourselves of the dangers of the spending silly season we’re about to enter. This year, perhaps more than ever, it’s extremely important to be careful as we have more wealth than at any time since we started on our journey. Black Friday sales are looming and Christmas is just around the corner with all the pressure of presents, extravagant food and office drinks and parties.
Now we have some wealth it would be easy to dip-in and enjoy ourselves a little but be warned, it’s not the amount of money that could be fatal but the breaking of good money habits. In the future we can start to take a sustainable income from our wealth but not yet, it’s far too early on in our journey. Becoming wealthy is a psychological challenge more than anything else and over the next couple of months we must resist the temptations that will confront us and must stay on plan.
WEALTH LADDER
With that in mind, it’s been a while since we last looked at our Wealth Ladder. It shows why we must stay on plan and is one of the most motivational things we can do so let’s update it and see what our projected wealth might look like. If you remember, we run 3 scenarios for CAGRs of 10%, 15% and 20% and look at what the Monthly and Lumpsum Plans might be worth in each scenario.
| CAGR | 10.00% | 10.00% | 15.00% | 15.00% | 20.00% | 20.00% |
| Yrs | Monthly | Lumpsum | Monthly | Lumpsum | Monthly | Lumpsum |
| 0 | $2,821 | $23,261 | $2,821 | $23,261 | $2,821 | $23,261 |
| 10 | $17,622 | $60,333 | $25,109 | $94,103 | $35,588 | $144,025 |
| 20 | $45,706 | $156,487 | $101,581 | $380,700 | $220,349 | $891,765 |
| 30 | $118,551 | $405,888 | $410,953 | $1.5m | $1.4m | $5.5m |
| 40 | $307,490 | $1.1m | $1.7m | $6.2m | $8.4m | $34.2m |
| 50 | $797,550 | $2.7m | $6.7m | $25.2m | $52.3m | $211.7m |
| 60 | $2.1m | $7.1m | $27.2m | $102.0m | $323.9m | $1.3bn |
| 70 | $5.4m | $18.4m | $110.1m | $412.5m | $2.0bn | $8.1bn |
| 80 | $13.9m | $47.6m | $445.3m | $1.7bn | $12.4bn | $50.2bn |
| 90 | $36.1m | $123.6m | $1.8bn | $6.8bn | $76.9bn | $311.1bn |
| 100 | $93.6m | $320.5m | $7.3bn | $27.3bn | $476.0bn | $1.9tn |
| 110 | $242.8m | $831.4m | $29.5bn | $110.5bn | $2.9tn | $11.9tn |
| 120 | $629.9m | $2.2bn | $119.3bn | $447.1bn | $18.2tn | $73.9tn |
It’s extremely important to always look at wealth as a journey rather than a destination and the ladder makes this extremely clear. Only by setting out on the journey in the first place and then climbing each and every rung on the ladder can we can achieve what most people think is impossible wealth. Yes, we’re chasing the crazy destination of $1 billion but it’s the rungs on the ladder that make it possible.
Take the 10-year rung if we make a 15% CAGR for example. Almost three years ago we started the Monthly Plan with absolutely nothing but now we could be looking wealth of $25,000 in ten years’ time, a huge achievement. On the Lumpsum Plan we might be getting close to $100,000 which will be a massive step on the road to a bright financial future.
Looking further out at the 40-year rung, if we make a 15% CAGR we can really start to see compounding kick in. The Monthly Plan is projected to be worth $1.7m and the Lumpsum Plan $6.2m and from there our wealth really starts to accelerate. If we make it to this rung then in the following 10 years the Monthly Plan is projected to make $5m resulting in wealth of $6.7m and the Lumpsum Plan makes a staggering $19m to be worth $25.2m. If we’re patient and see wealth as a journey then remarkable things can happen. We’re on plan and are building an incredible financial future even if we don’t quite get to the $73.9 trillion in the bottom right of the table…
WATCHLIST
In previous posts, when we’ve done portfolio reviews we’ve compared our live portfolio to different alternative ones such as: a better Overall Portfolio; one that maximises CAGR; and one that reduces drawdowns. We then looked at the investments in the new portfolios and added new ones to our Watchlist but in the real world, things happen the other way round. Normally we do our research to find investments, add them to our Watchlist and then review our portfolio to see if we want to change it and that’s what we’re going to do this month.
Over the last month, we went through our research process and found an investment trust called Rockwood Strategic plc or “RKW” for short. We added it to our Watchlist and updated our four core metrics for all investments for the 10 years to 30/Sep and our updated list looks like this:
| Count | Live | Ticker | CAGR | WRTN.CAGR | DD.Avg | DDT.Avg | Fund |
| 1 | Yes | ATT | 25.9% | 7.0% | 33.9% | 242 | Allianz Technology Trust PLC |
| 2 | Yes | IITU | 25.3% | 16.5% | 22.4% | 169 | iShares S&P 500 Information Technology |
| 3 | Yes | PCT | 24.0% | 7.3% | 28.8% | 214 | Polar Capital Technology Trust PLC |
| 4 | Yes | XDWT | 23.6% | 11.2% | 26.7% | 184 | Xtrackers MSCI World Information Technology UCITS ETF 1C |
| 5 | Yes | EQQQ | 19.8% | 11.4% | 21.2% | 198 | Invesco NASDAQ 100 UCITS GBP Hedged |
| 6 | ITWN | 18.3% | 2.1% | 24.1% | 255 | iShares MSCI Taiwan UCITS ETF | |
| 7 | Yes | SMT | 16.9% | (7.0%) | 31.3% | 341 | Scottish Mortgage Investment Trust PLC |
| 8 | Yes | XDEM | 15.4% | 6.3% | 18.8% | 219 | DB X-Trackers MSCI World Momentum Factor UCITS DR 1C |
| 9 | Yes | CSP1 | 14.7% | 9.0% | 17.9% | 165 | iShares Core S&P 500 UCITS (Acc) GBP Hedged |
| 10 | RKW | 14.5% | (1.3%) | 23.4% | 236 | Rockwood Strategic plc | |
| 11 | Yes | OCI | 14.3% | 6.7% | 24.5% | 219 | Oakley Capital Investments Limited |
| 12 | Yes | JAM | 13.8% | 6.6% | 22.7% | 207 | JP Morgan American Investment Trust PLC |
| 13 | HVPE | 12.1% | 1.5% | 22.8% | 321 | HarbourVest Global Private Equity Ltd | |
| 14 | MTE | 10.6% | (5.4%) | 27.9% | 343 | Montanaro European Smaller Companies Trust PLC | |
| 15 | IEM | 8.0% | (3.3%) | 24.5% | 340 | Impax Environmental Markets PLC |
Key: WRTN = Worst Return, DD = Drawdown, DDT = Drawdown Time in business days
Notes: 10 years ending 30/09/2026, capital return only, annual rebalancing to equal weights, constant FX rates.
Ten of the investments make up our Crazy Fund research portfolio and there are 5 additional ones we’re monitoring. As you can see, RKW has a better return than 5 investments already on our Watchlist including OCI and JAM which are in our live portfolio. A quick look at RKW reveals that it’s listed on the London Stock Exchange and is a small investment trust with a market value of £190 million (share price 308p). The trust invests in UK smaller companies and aims to deliver a return over the long term of 15% a year which, looking at our Watchlist, it has more or less done over the last 10 years with a CAGR of 14.5% without dividends. Now we’ve our updated Watchlist we can move on and review our portfolio.
PORTFOLIO REVIEW
Remember that the objective of portfolio reviews is to ensure we have a solid portfolio and we do that by looking at Return, Consistency of Return and Drawdowns over the last 10 years. Also remember that changing investments is not free as we discussed last month as there are dealing fees and other costs that might be incurred and so a change needs to be really persuasive for us to move ahead with it. We’ve sorted the Watchlist by CAGR and we simply start at the top and work our way down thinking about each investment and how it looks compared to the others above and below it. So, what stands out and are there are any changes we want to make to our portfolio?
ITWN
ITWN is a high CAGR fund we don’t own and perhaps should and it popped up in our last portfolio review. At the time we decided to not make a change since it’s highly correlated to a large part of our portfolio, namely Technology and the US. We also saw that it could be experiencing a Spike as it had returned 73% in the first 6 months of the year which is picked up with its WRTN.CAGR being towards the lower end of all the investments on our Watchlist. Our view hasn’t changed since last time so we’ll keep it on our Watchlist.
SMT
When we look at our Watchlist, SMT stands out for all the wrong reasons. A WRTN.CAGR of (7.0%), so a loss, is terrible compared to other investments as are the five worst drawdowns averaging (31.3%) and the five longest which average a huge 341 days and remember, these are business days so if you include weekends it would feel like an eternity in drawdown. Despite these terrible numbers though, SMT has still managed to achieve a CAGR of 16.9% which is extremely solid and above our long-term target of 15%. Something tells us that we should be thinking of replacing SMT but with what? We’re going to leave ITWN for now so that leaves us with RKW. Let’s have a look at the differences in return between SMT and RKW:
| Ticker | SMT | RKW | Diff %/£ |
| Return % | 16.9% | 14.5% | 2.4% |
| Invest £ | 1,000 | 1,000 | 0 |
| 10 | 4,771 | 3,867 | 903 |
| 25 | 49,707 | 29,414 | 20,294 |
| 50 | 2,470,816 | 865,162 | 1,605,654 |
We’re investing for decades and over that timescale the effects of compounding really kick in. £1,000 invested over 50 years is either worth £2.47million at 16.9% or £0.87 million at 14.5%, a huge difference. If we keep changing to investments with CAGRs 2.4% lower than ones we already own it’s really going to hurt in the long run. A reason to switch is to improve consistency and also, if we switch, we will diversify. Our current portfolio has a lot of technology and US exposure whereas RKW is focused on UK smaller companies and this focus really is different to anything we currently have in the portfolio.
If we look a little closer at RKW we see it doesn’t have a really strong WTRN.CAGR, being a loss of (1.3%) and its drawdowns are middle of the pack with the five worst averaging (23.4%). If you read up on SMT you’ll see it’s been around for 117 years and a chart for the last 40 years shows that it’s a volatile fund but it makes money over the long-term, hence why it’s still here 117 years later.
There are powerful arguments on both sides as to whether or not to switch and we ended up 50:50 so for this review, CAGR wins out and we’re going to keep SMT. If RKW had better consistency with a positive WTRN.CAGR we suspect we would have made the change.
OCI & JAM
OCI and JAM stand out as they are the worst two performing funds in our portfolio from a CAGR perspective and we’re always looking to improve our return. What about selling one of them and replacing it with RKW? Selling OCI doesn’t achieve much as there is virtually no difference in CAGR and OCI has far better consistency as shown with the WRTN.CAGR. We also view JAM the same way as it’s been a really consistent fund. For us, swapping OCI or JAM would not give a sufficient increase in CAGR for the loss of consistency so we’ll keep them in our portfolio for now and keep monitoring.
THE CRAZY FUND RESEARCH PORTFOLIO
Below are the metrics for our live research portfolio updated for the 10 years to 30/Sep. We’ve also included the results for the portfolio that sells SMT and replaces it with RKW which is “-SMT / +RKW” along with both funds’ individual results as well.
| Result | Live.PF | -SMT / +RKW | SMT | RKW |
| CAGR | 20.1% | 19.8% | 16.9% | 14.5% |
| £1 in 10 yrs: | 6.3 | 6.1 | 4.8 | 3.9 |
| £1 in 25 yrs: | 98 | 91 | 50 | 29 |
| £1 in 50 yrs: | 9,626 | 8,323 | 2,471 | 865 |
| WRTN.CAGR | 10.5% | 11.5% | (7.0%) | (1.3%) |
| WRTN1 | (13.6%) | (10.5%) | (47.6%) | (17.3%) |
| WRTN2 | 6.0% | 7.5% | (11.1%) | (8.2%) |
| WRTN3 | 15.0% | 19.1% | (7.5%) | 3.7% |
| WRTN4 | 24.4% | 22.0% | 26.5% | 7.0% |
| WRTN5 | 26.0% | 23.6% | 27.7% | 11.3% |
| DD.Avg | 22.8% | 21.3% | 31.3% | 23.4% |
| DD1 | 28.9% | 29.5% | 60.3% | 36.2% |
| DD2 | 27.2% | 23.7% | 28.9% | 24.7% |
| DD3 | 24.5% | 23.1% | 28.1% | 20.7% |
| DD4 | 19.9% | 19.3% | 22.3% | 18.0% |
| DD5 | 13.3% | 10.8% | 17.0% | 17.4% |
| DDT.Avg | 203 | 178 | 341 | 236 |
| DDT1 | 521 | 412 | 1,149 | 295 |
| DDT2 | 160 | 159 | 230 | 229 |
| DDT3 | 127 | 119 | 151 | 221 |
| DDT4 | 111 | 114 | 99 | 219 |
| DDT5 | 97 | 84 | 77 | 214 |
Key: WRTN = Worst Return, DD = Drawdown, DDT = Drawdown Time in business days
Notes: 10 years ending 30/09/2026, capital return only, annual rebalancing to equal weights, constant FX rates.
The potential new portfolio actually looks very good and is more consistent with the standout number being the DDT1 which is reduced massively by over 100 days. It’s amazing how just changing one fund can have such a big impact on our portfolio, that’s what a terrible statistic can do. So, what do the charts look like?
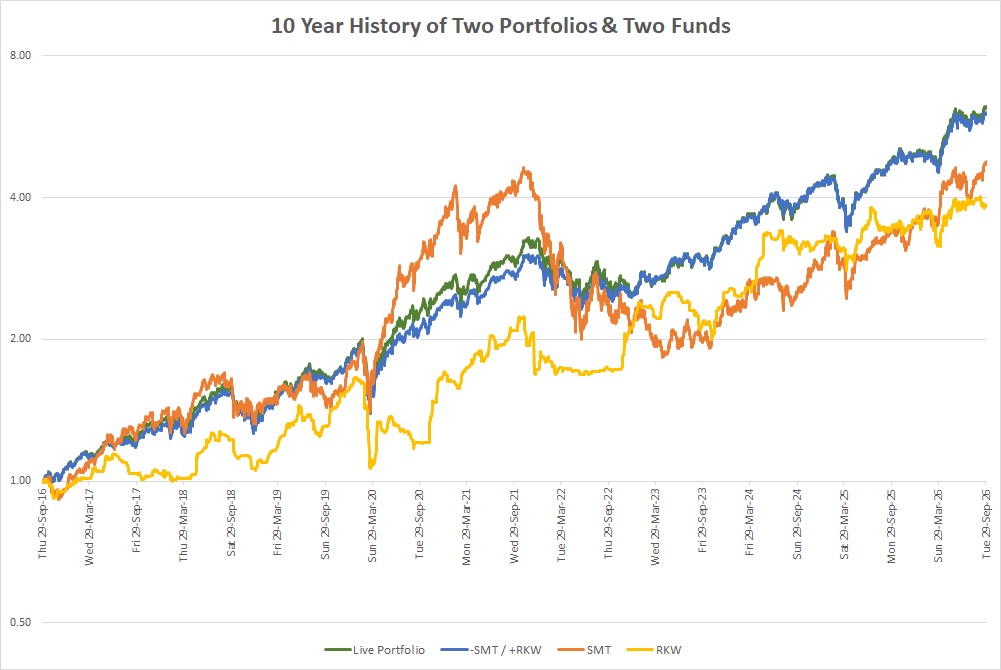
Again, the significant difference in drawdown statistics can be seen clearly with RKW being much more consistent over the 10 years than SMT. As we’ve said, we were 50:50 to do the swap but for now we’re sticking with our current portfolio and will review it again in 3 months’ time.
CONCLUSION
We’ve slightly got ahead of ourselves in this post as we’re talking about constructing a portfolio and we haven’t written that post yet, it’s scheduled for early in the new year. However, what we’re seeing is that there’s no right answer as it depends on how you weight return, consistency of return, drawdown and length of drawdown. No one has a crystal ball and we’ve chosen to focus on return whilst keeping consistency high up the priority list. You may well want to do the opposite and make the switch of RKW for SMT to improve the consistency of the portfolio and that may well end up being a better choice than ours.
Over the coming years we’ll get some investments right and some wrong and so it’s essential to regularly review our portfolio. The best way to do that is to have a method for performing reviews and then apply it consistently. Our method is our four core metrics and our consistency is reviewing our portfolio every quarter. There will come a time when a new investment leaps off the page and when it does, we’ll make a change but we mustn’t make a change due to boredom or the need to feel busy.
Sometimes, the hardest thing with investing is doing nothing but just think about this for a moment, SMT has been around for 117 years. If our great-great grandparents had put a modest amount of money into the fund back then we’d be rather grateful to say the least, even if future generations had done absolutely nothing afterwards. A fund being around for 117 years shows the potential to create wealth and the importance of thinking long-term. If we are patient then perhaps our plan might not be quite so crazy after all.
THE INVESTMENT REPORT
For an explanation of The Investment Report and The Crazy Fund please see our post “1.1 The Deep End”
| Fri 30-Oct-26 | Monthly Plan | Lumpsum Plan |
| Cash last month £ | 151 | 0 |
| Cash Saved £ | 50 | 0 |
| Unit buys / sells £ | 0 | 0 |
| Total Cash £ | 201 | 0 |
| Units last month | 1,097 | 10,000 |
| Units bought / sold | 0 | 0 |
| Total Units owned | 1,097 | 10,000 |
| Unit Price £ | 1.7377 | 1.7377 |
| Fund Value £ | 1,906 | 17,377 |
| Total Wealth £ | 2,108 | 17,377 |
| FX Rate | 1.3386 | 1.3386 |
| Total Wealth $ | 2,821 | 23,261 |
| Estimated CAGR | 15.00% | 15.00% |
| Years to $1billion | 85yrs 10mths | 76yrs 4mths |
We’re approaching the end of our third year and on the Monthly Plan, our regular savings just keep on building our wealth. Both plans are on track and we’ve not broken our good money habits which is key to building a bright financial future. As we saw in the Wealth Ladder above, it’s not our goal of $1 billion that’s important but the journey. When our wealth hits some of the higher rungs on the ladder in years to come, we’ll start to draw an income and will reap the rewards of our hard work and patience.
THE CRAZY FUND
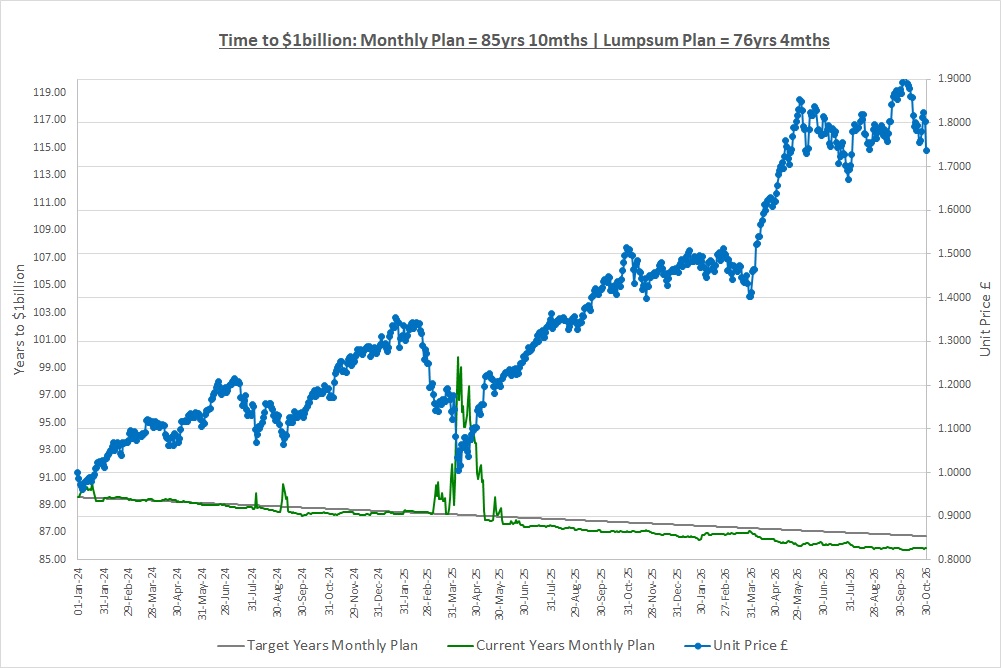
| Results | 30-Sep-26 | 30-Oct-26 | MTD Move | YTD Move | LTD Move |
| Unit Price £ | 1.8765 | 1.7377 | (7.40%) | 18.63% | 73.77% |
| FX Rate | 1.3250 | 1.3386 | 1.03% | (0.64%) | 5.22% |
| Unit Price $ | 2.4864 | 2.3261 | (6.45%) | 17.88% | 82.83% |
| CAGR £ | 25.74% | 21.56% | (4.18%) | 0.54% | 21.56% |
It was not a great month with our investments losing (7.4%). The FX rate saved us a little when we look at our wealth in USD but even so, we ended the month down almost (6.5%) in USD terms. We’re in another large drawdown and have no idea how big or long it will be but one thing we do know is that we must keep up the good money habits we’ve formed. Keeping our eye on the long-term and the Wealth Ladder is essential and we must remember that since we started, our CAGR has comfortably beaten inflation and we’re on plan.
Below is a table of what the fund is invested in at 30/October:
| Ticker | % Fund | Price | CCY | Type | Description |
| LON:CSP1 | 9.5% | 61,220.00 | GBP | ETF | iShares Core S&P 500 UCITS (Acc) GBP Hedged |
| LON:JAM | 9.3% | 1,212.00 | GBP | IT | JP Morgan American Investment Trust PLC |
| LON:EQQQ | 9.4% | 51,946.00 | GBP | ETF | Invesco NASDAQ 100 UCITS GBP Hedged |
| LON:IITU | 10.2% | 3,733.00 | GBP | ETF | iShares S&P 500 Information Technology |
| LON:XDWT | 10.3% | 140.70 | USD | ETF | Xtrackers MSCI World Information Technology UCITS |
| LON:ATT | 10.0% | 659.00 | GBP | IT | Allianz Technology Trust PLC |
| LON:PCT | 10.8% | 592.50 | GBP | IT | Polar Capital Technology Trust PLC |
| LON:SMT | 10.6% | 1,495.00 | GBP | IT | Scottish Mortgage Investment Trust PLC |
| LON:OCI | 10.6% | 542.00 | GBP | IT | Oakley Capital Investments Limited |
| LON:XDEM | 9.2% | 6,817.00 | GBP | ETF | DB X-Trackers MSCI World Momentum Factor UCITS |
| Shares | 99.9% | ||||
| Cash | 0.1% |
There were no changes to our portfolio during the month and no dividends were received.
A FAVOUR
If you find our posts helpful in building a bright financial future then in exchange, please sign up to receive them by email. The more people that subscribe the more we grow which means we can create more content to help you become unimaginably wealthy. You can sign up using the subscribe box at the top of our website: https://thecrazyplan.com
*** Please spread the word!
This blog is free as we want everyone to have access to financial education. We hope to inspire you to set out on your own journey to a bright financial future and if we do, in return please spread the word to others.
NEXT MONTH
Next month we’re going to look at the actual process of buying an investment and we’ll talk through some of the jargon you might come across. Again, it’s just more of the language of investing and once you learn it, you’ll realise it’s not complicated.
DISCLAIMER
Please note that by the time this blog is published, we may no longer own some or any of the investments discussed. Strategies and investments discussed might be totally unsuitable for you and we are not recommending them to you, they should only be considered as ideas for further research. You must read and agree to our Terms & Conditions, including the Disclaimer, which can be found on the T&C page of our website: https://thecrazyplan.com
© TradeFloor Promotions Limited 2026

