July 2026
WELCOME
Welcome to The Crazy Plan where our mission is to show that anyone can create unimaginable wealth.
Each month, we publish a blog providing readers with the financial education needed to set out on their own journey to a bright financial future. We do this by following two plans, our Monthly Plan saves £50 a month for 10 years and our Lumpsum Plan starts with a one-off £10,000. Our aim is to turn each plan into $1 billion in one or two generations.
At first, making $1 billion seems crazy but once you realise it’s a journey then things change. We’ll save our first £50 and from there our wealth will build to $1,000, then $5,000, then $10,000 and then $50,000. One day, if we’re patient, we’ll have $100,000 and then we’ll be looking at $1 million. From there it will be onwards to our $1 billion goal. This journey of small steps is how what seems impossible becomes possible.
You can dig-in to our posts however you like or if you are completely new to investing, you may want to start with “1.0 Liftoff!” and go through them in order which is how we build the education. We hope to provide you with the knowledge needed to set out on your own journey to a bright financial future if you choose. You can also visit the “About” page on our website to learn more about our plan.
All readers must read and agree to our Terms & Conditions, including the Disclaimer, which can be found on the T&C page of our website: https://thecrazyplan.com
ON WITH THE PLAN
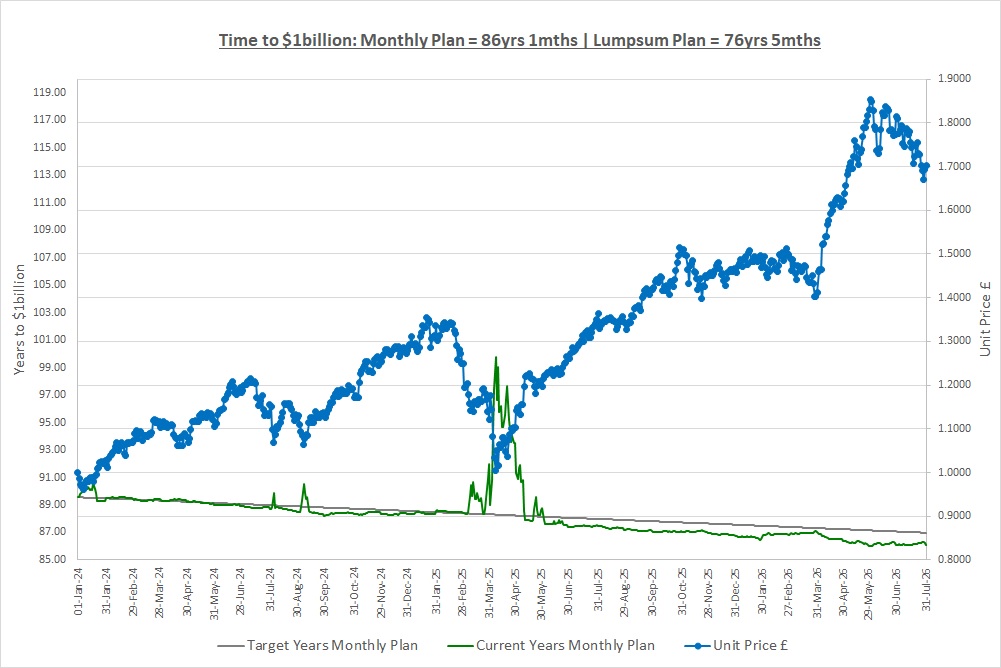
Our Lumpsum Plan will be worth $1billion in: 76yrs 5mths
Our Monthly Plan will be worth $1billion in: 86yrs 1mth
Please subscribe for free to receive our posts by email using the Subscribe box at the top of our website!
The Monthly Plan Invests!
As you’ll see later on in the post, the time has come for The Monthly Plan to invest as another 6 months has passed with us saving £50 a month. This is a huge moment and turns us from savers into investors. It’s by investing that we can look to earn the returns needed to beat inflation and create a bright financial future. This is now the fifth time we have invested our savings and so we are embedding this habit alongside the habit of saving. These are the key habits needed to build wealth and we can see our wealth slowly building.
Last Month
Last month we hit the pause button and revisited the four key metrics we look at to help us choose a fund. To recap, we look historically over the last 10 years at a fund’s:
- Return, so CAGR (“CAGR”);
- Consistency of Return, the 5 worst annual returns (“WRTN.CAGR”);
- Drawdowns, the 5 biggest (“DD.Avg”); and
- Length of Drawdowns, the 5 longest (“DDT.Avg”).
For us, these four metrics help to answer the question of whether a fund manager is any good at their job and more importantly, will they continue to be any good? We concluded by saying that when looking at a single fund, they might not provide a clear answer but their power is when they are used to compare across funds. This month we’re going to perform our quarterly review of our portfolio and look at our watchlist but before that, let’s just think about keeping things simple.
KEEP IT SIMPLE
It might not seem like it as we’re covering a lot of education on investing, but if you stop and think about our actual investing plan it’s really simple. We’re looking for 10 solid investment managers and are handing over the investment responsibility to them. If we do this and invest for decades, we can ride the relentless march higher of markets that’s historically returned a 10% CAGR. Of course, there’s no guarantee that markets will continue to march higher but we have 150 years of history on our side.
When investing, it’s far more important to have a simple plan and understand how it will make money over the long-run than to have a really complicated plan that you “hope” will work out. If it sounds too simple then that’s because it is, with one exception. The difficult part is that hardly anyone can stick to our plan.
Think about it for a moment, you could just buy an S&P500 tracker ETF, leave it alone for decades, earn 10% a year and become wealthy beyond your wildest dreams. The question is though, could you leave it alone for decades? Most people can’t and always give in to temptation too soon, interrupting the compounding process and destroying their chances of becoming seriously wealthy.
Having a simple plan makes it easier to stick to but even so, sometimes you might feel tempted to quit and a little motivation is needed. Remember, spending a couple of hours a week on your plan means you’re earning $107,158 per hour as we said back in post “1.2 Sacrifice, Temptation & Commitment” so quitting would be rather expensive!
PORTFOLIO REVIEW
These reviews are going to become very, very, boring as we’ll perform dozens and dozens of them over the coming years. Also, we suspect we’ll hardly change the portfolio as good, consistent managers tend to last, but not always. These reviews are fundamental to our success as they’ll ensure we have a strong portfolio which will grow our wealth and hopefully allow us to hit our $1 billion goal a little ahead of estimate.
The important thing about these early reviews, when you’re new to them, is to look over the tables and charts several times and think about our four key metrics. You’ll weight things differently to us and the only way you’ll start to work out which funds to invest in is by putting in the time now to establish what’s important to you. So, what has our review thrown up this quarter?
| Result | Live.PF | Overall | CAGR | AvgDD |
| CAGR | 21.5% | 20.6% | 21.7% | 19.4% |
| £1 in 10 yrs: | 7.0 | 6.5 | 7.1 | 5.9 |
| £1 in 25 yrs: | 130 | 109 | 136 | 85 |
| £1 in 50 yrs: | 16,960 | 11,848 | 18,391 | 7,211 |
| WRTN.CAGR | 9.1% | 8.9% | 8.2% | 7.9% |
| WRTN1 | (12.5%) | (14.4%) | (13.7%) | (11.8%) |
| WRTN2 | 6.9% | 9.0% | 6.6% | 6.9% |
| WRTN3 | 14.3% | 13.5% | 15.0% | 12.2% |
| WRTN4 | 17.8% | 20.1% | 16.9% | 14.8% |
| WRTN5 | 23.0% | 20.6% | 19.9% | 20.6% |
| DD.Avg | 22.8% | 22.1% | 22.2% | 21.0% |
| DD1 | 28.9% | 28.2% | 29.3% | 27.1% |
| DD2 | 27.2% | 27.6% | 27.7% | 25.0% |
| DD3 | 24.5% | 22.2% | 23.9% | 21.7% |
| DD4 | 19.9% | 19.5% | 18.2% | 18.4% |
| DD5 | 13.3% | 12.9% | 12.1% | 12.6% |
| DDT.Avg | 203 | 193 | 196 | 197 |
| DDT1 | 521 | 521 | 518 | 540 |
| DDT2 | 160 | 164 | 160 | 160 |
| DDT3 | 127 | 97 | 121 | 103 |
| DDT4 | 111 | 96 | 95 | 97 |
| DDT5 | 97 | 86 | 88 | 86 |
Key: WRTN = Worst Return, DD = Drawdown, DDT = Drawdown Time in business days
Notes: Metrics for 10 years ending 30/06/2026, Capital return only (no dividends), Constant FX rates
The first thing to note is that there’s a lot of information in the table but when you take a step back, it’s just our four metrics and the details of each one. We can now see the power of our metrics as we’ve built them to be used for portfolios as well as single funds. This is a huge advantage as we can compare a portfolio to a fund which will allow us to potentially see which fund could be a drag on CAGR for example or is causing long drawdowns.
When viewing the table, always think “Do I want to swap the Live.PF for this one?” There’s no right or wrong answer as remember, this is all backwards looking and extremely personal but we always need to be thinking about how we can improve. To be honest, this quarter we struggled and were tempted to move to the CAGR portfolio but in the end, we decided not to. Let’s have a look at the chart of the last 10 years on a log scale:
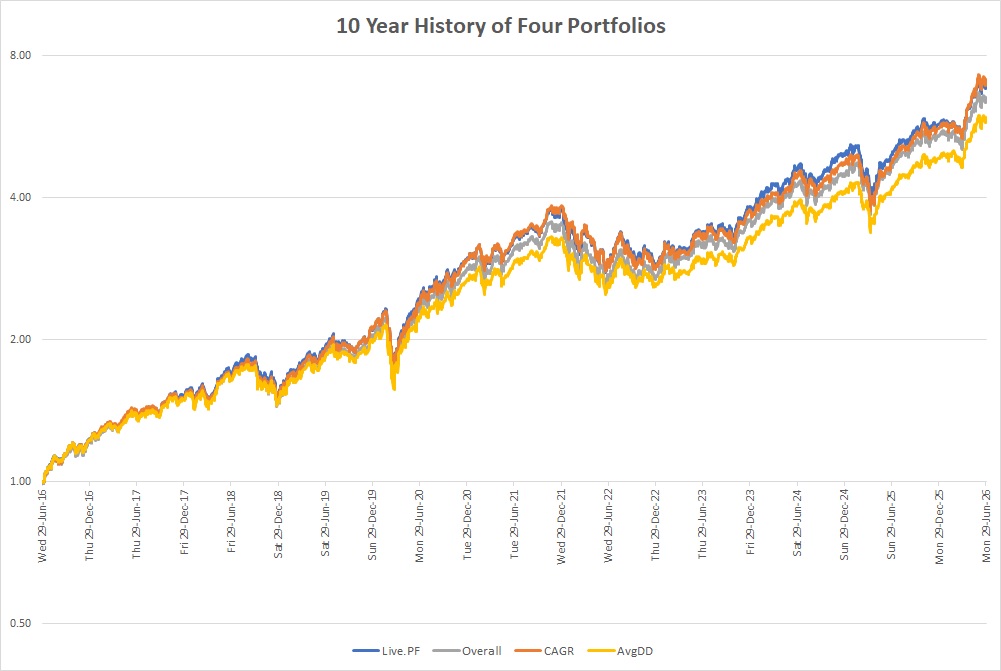
Of course, there’s one huge question that’s unanswered and that’s “What’s in the new portfolios?” We’ll save that for another day so we don’t overwhelm the post with the exception of the CAGR portfolio as discussed below where we’ll look at the investments in it.
Overall Portfolio
If you remember, this is our attempt to get a little of everything and you can see that historically it’s returned a more than acceptable CAGR over the 10 years of 20.6%. All the other metrics are strong too but let’s be honest, the differences to our Live.PF are small when it comes to the Worst Returns, Drawdowns and Length of Drawdowns. Would we really give up 0.9% a year to move to this? No, we would not.
Just to put some numbers on it, what impact does 0.9% a year have on our investments? Well, the table shows that over 10 years £1 would be worth £7.00 for our Live.PF compared to £6.50 for the Overall portfolio. That might not seem like much but we’re not investing for 10 years, we’re investing for decades and that means £1 would be worth £16,960 compared to £11,848 over 50 years. Yes, £1 becomes £16,960 at a 21.5% CAGR for 50 years!
We’re also not investing £1 and £10,000 becomes worth a staggering £169 million compared to £118 million, £51 million more! Now, we don’t expect to earn 21.6% a year and are targeting a 15% CAGR but it reveals that the true power of compounding is over decades and why we need to take a long-term view. It also demonstrates why return is so important.
Best CAGR Portfolio
With this portfolio we look to maximize return and historically it’s CAGR was 0.2% better than our Live.PF at 21.7%. It also had slightly better Drawdowns and Length of Drawdowns but the price to pay was giving up a small amount on the 5 worst returns. When we look at the individual 5 worst returns though there’s not too much in it with both our Live.PF and the CAGR portfolio having one losing year and the other four worst years were all solid for both portfolios. As we’ve just seen, the impact of return is key in building wealth and so that extra 0.2% would be great to have.
There’s one issue though, it’s not free to move to the new portfolio as we’d have to sell existing investments and buy new ones all of which would involve costs. We’re going to cover costs in an upcoming post so we’re getting slightly ahead of ourselves here but we need to think about them as they are real and reduce our wealth. Let’s work on the basis that we’d like to move to this new portfolio, costs aside, so the big question is what’s in this portfolio?
Well, the new CAGR portfolio replaces two of our existing investments with new ones and to move to it we’d have to do the following:
- Sell our shares in JAM and XDEM that we currently hold
- Buy new shares in HVPE and ITWN.
JAM is JP Morgan American Investment Trust and invests in US companies. If you remember, it’s very highly correlated to the S&P500 as we saw when we looked at this in post “1.8 Investing Small Amounts & Correlation” where at the time, the correlation was +99.4%. Researching on-line for the top 10 holdings of JAM shows that they are heavy on technology investments.
XDEM is DB X-Trackers MSCI World Momentum Factor but if you remember, when we looked at “World” markets we saw that there was a huge domination of US companies as the US is by far the largest in the world. When you dig a little deeper you also see that XDEM has a lot of technology in it as well.
So, what about the two potential new investments? Well, HVPE is HarbourVest Global Private Equity which is an investment trust in the Private Equity (“PE”) space and we talked about PE in our last portfolio review, post “3.4 Portfolio Review & Private Equity.” When we look at the top 10 holdings there are again technology holdings featuring prominently and there is a heavy bias to the US as you would expect.
ITWN is a tracker ETF that tracks the Taiwan stock market index and this index is again heavily weighted to technology companies with almost 30% of the index being a single stock, Taiwan Semiconductor Manufacturing Co (“TSMC”). TSMC is the largest semiconductor manufacturer in the world and the other largest holdings in the index also have a large technology bias.
This is where we started to get stuck in deciding whether to change to the CAGR portfolio. It looks like moving from JAM and XDEM would replace a lot of technology exposure with technology exposure and a lot of US exposure with a fair amount of US exposure! Add to this the fact that the Taiwan market is highly correlated to the US market (the fortunes of TSMC are tied to the success of all the big US technology companies) and we might get less diversification than the headline “Taiwan” suggests.
Then there‘s the question of Spike, Step and Slope which we discussed in post “3.5 Choosing a Fund: Strong Foundations.” Looking at a chart of JAM verses ITWN below for example, we can see they are highly correlated except over the last 6 months or so where we see ITWN race ahead.
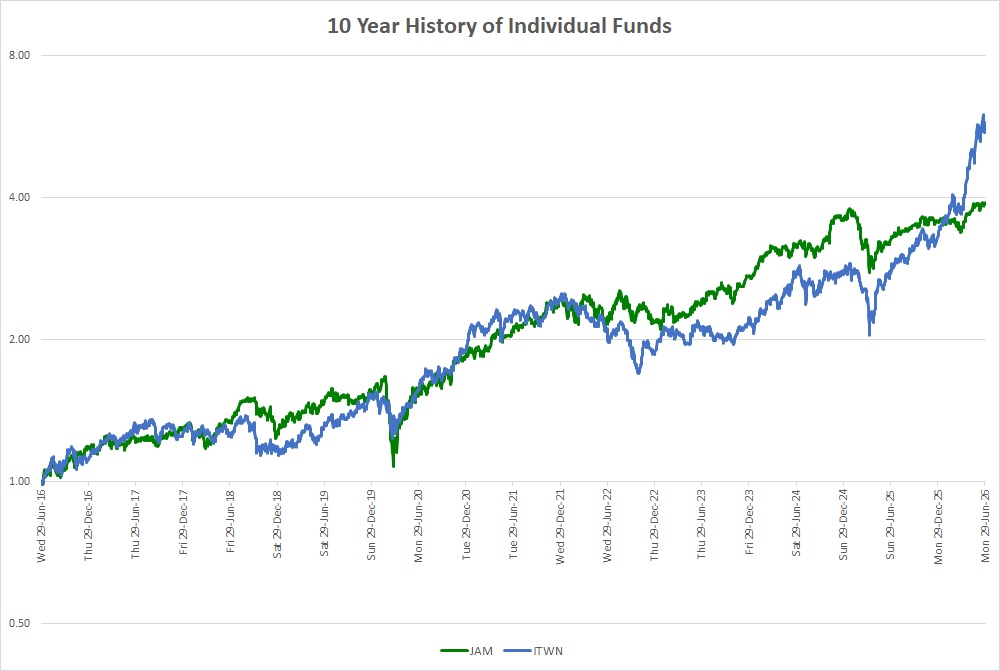
So, the question is whether ITWN is going to turn out to be a Spike or Step for a few years or whether it will continue to march higher and be a Slope? So far in 2026, JAM is up around 9% but ITWN is up an astonishing 73% and that’s in 6 months! These sorts of returns are abnormal and so there’s a high chance that ITWN has only come onto our radar due to the last 6 months. In fact, looking at the WRTN.CAGRs in the Watchlist below we see that ITWN has a negative WRTN.CAGR of (0.3%) compared to its 10yr CAGR of 19.2%. This suggests a Spike or Step which is what we’re seeing in the chart and means it hasn’t been a consistent fund. Remember, we want consistency as well as outright return. JAM on the other hand has a positive WRTN.CAGR of +6.3% compared to its 10yr CAGR of 14.6% so has historically been a far more consistent fund.
The consistency issue won-out for us as the CAGR portfolio had a WTRN.CAGR of 8.2% compared to our Live.PF of 9.1%. That’s why we decided to do nothing and leave our portfolio as it is.
Best AvgDD Portfolio
If you remember, this portfolio aims to minimise drawdowns and from the table we can see the worst 5 drawdowns were an average of 21.0% compared to 22.8% for our Live.PF so a modest reduction. The question is though, would we be happy to have a 10yr CAGR that’s (2.1%) lower than our current portfolio? No way. We saw the impact of just 0.9% over 50 years above and so giving up 2.1% a year? That could be worth a fortune in a few decades time. At the end of the day, if we’re down 22% on average then being down “only” 20% isn’t going to feel that much better. How much of an improvement would we like to see to give up this much return? We honestly don’t know but maybe a 5% improvement would start to make us think about a change. It’s more than likely going to be the WRTN.CAGR that has the biggest impact on our decision than reducing drawdowns by 5% though as we want consistency.
Other Portfolios
As we mentioned last time, we could of course choose to build portfolios to optimise different measures such as DDT.Avg or WRTN.CAGR, there are so many ways to put portfolios together and it’s a personal thing so have a think about what’s important to you. We always look at the Overall portfolio as it has a little of everything and that’s never a bad place to start.
WATCHLIST
Our portfolios get built from our Watchlist and we can use our four metrics across individual funds and portfolios as we’ve discussed. We now have a Watchlist of 14 funds since we started being the 10 funds we currently have in The Crazy Fund, MTE which we replaced in 2024, IEM which we replaced earlier this year and the additions of HVPE and ITWN from this post. So, what do their key metrics look like?
| Count | Ticker | CAGR | WRTN.CAGR | DD.Avg | DDT.Avg | Fund |
| 1 | ATT | 28.3% | 7.7% | 33.9% | 242 | Allianz Technology Trust PLC |
| 2 | PCT | 27.6% | 5.3% | 28.8% | 214 | Polar Capital Technology Trust PLC |
| 3 | IITU | 26.1% | 14.9% | 22.4% | 169 | iShares S&P 500 Information Technology |
| 4 | XDWT | 24.2% | 11.5% | 26.7% | 184 | Xtrackers MSCI World Information Technology |
| 5 | EQQQ | 21.1% | 11.0% | 21.2% | 198 | Invesco NASDAQ 100 UCITS GBP Hedged |
| 6 | ITWN | 19.2% | (0.3%) | 23.5% | 255 | iShares MSCI Taiwan UCITS ETF |
| 7 | SMT | 18.3% | (4.7%) | 31.3% | 336 | Scottish Mortgage Investment Trust PLC |
| 8 | XDEM | 17.7% | 5.9% | 18.8% | 219 | DB X-Trackers MSCI World Momentum Factor UCITS DR 1C |
| 9 | CSP1 | 15.1% | 8.1% | 17.9% | 165 | iShares Core S&P 500 UCITS (Acc) GBP Hedged |
| 10 | JAM | 14.6% | 6.3% | 22.7% | 207 | JP Morgan American Investment Trust PLC |
| 11 | OCI | 14.3% | (0.2%) | 24.5% | 206 | Oakley Capital Investments Limited |
| 12 | HVPE | 14.0% | 0.9% | 22.8% | 321 | HarbourVest Global Private Equity Ltd |
| 13 | MTE | 12.2% | (3.2%) | 27.9% | 330 | Montanaro European Smaller Companies Trust PLC |
| 14 | IEM | 9.5% | (4.4%) | 24.5% | 327 | Impax Environmental Markets PLC |
You’ll be pleased to know that we’re not going to talk about the Watchlist, we’ve covered enough ground already this month. We’ll leave you to look and think about the funds and perhaps you might find some of your own to add. As you look at the data think about where you are drawn, what your red lines might be, what information are you missing, go and look at the website for some of the funds that interest you. This is what a Watchlist is for and it’s the key to success.
CONCLUSION
We hope this post shows that there’s no easy answer to the question “What funds should I buy?” The only way the answer becomes a little clearer is by making a habit of reviewing your portfolio and having some metrics that allow you to perform that review in a structured and consistent way. As you can see above, from a CAGR perspective it was tempting to move to the new CAGR portfolio but when we looked at the four core metrics of ITWN we became nervous. We also saw from a quick review of top holdings that we would be staying mostly in technology with a high US focus so what was the point of changing investments and worsening the consistency of the portfolio?
Sometimes in investing, the hardest thing to do is nothing. If you go on-line and into chat rooms it’s all about next month or next quarter and chopping and changing investments all the time to try and make money. This is hugely time consuming, hardly anyone is any good at it over the long-run, it’s complicated and usually results in people losing money or giving up as it’s not sustainable for most people over decades.
Over the last two and a half years, our portfolio has been a good “cake” and has performed well. What we’re doing with these reviews is making sure we keep our cake fresh and we’re also seeing if we can find some icing. Perhaps HVPE and ITWN would have turned out to be the icing, perhaps they wouldn’t, but either way we think we have a pretty good cake at the moment so we;ll move on and perform another review in three months’ time.
Remember, it’s far better to have a simple plan. We have just four metrics for funds and portfolios which is far easier than having a really complex plan. We are going to ride that long-term wave of markets and doing the portfolio review and keeping a Watchlist are the keys to success.
THE INVESTMENT REPORT
For an explanation of The Investment Report and The Crazy Fund please see our post “1.1 The Deep End”
| Fri 31-Jul-26 | Monthly Plan | Lumpsum Plan |
| Cash last month £ | 305 | 0 |
| Cash Saved £ | 50 | 0 |
| Unit buys / sells £ | (304) | 0 |
| Total Cash £ | 51 | 0 |
| Units last month | 930 | 10,000 |
| Units bought / sold | 167 | 0 |
| Total Units owned | 1,097 | 10,000 |
| Unit Price £ | 1.7020 | 1.7020 |
| Fund Value £ | 1,867 | 17,020 |
| Total Wealth £ | 1,919 | 17,020 |
| FX Rate | 1.3472 | 1.3472 |
| Total Wealth $ | 2,585 | 22,929 |
| Estimated CAGR | 15.00% | 15.00% |
| Years to $1billion | 86yrs 1mths | 76yrs 5mths |
The Monthly Plan Invests
On 01/July we had just over £305 of cash in the Monthly Plan and we used this to buy units in The Crazy Fund. This is a huge moment, it’s the moment we turn from savers into investors and remember, it’s through investing that we can earn the returns needed to beat inflation and create a bright financial future.
The cash we had was from 6 months of saving £50 a month plus the interest we received on our bank account back in January. We bought 167 units at a price of 1.8195 spending £303.86. Since then, the unit price has come off and we’ve lost on this purchase as the price at the end of the month was 1.7020. We must not worry about this, it is extremely frustrating that as soon as we buy the price comes off but sometimes it will go the other way and the value of our investments will race ahead. We’ve now bought 1,097 units in total on the Monthly Plan spending a total of £1,509.54 which works out at an average price of 1.3761 per unit so we’re well ahead. This regular buying, called pound / dollar cost averaging, smooths our purchases out and in decades to come, a price of 1.8195 will more than likely look like a bargain.
THE CRAZY FUND
| Results | 30-Jun-26 | 31-Jul-26 | MTD Move | YTD Move | LTD Move |
| Unit Price £ | 1.8157 | 1.7020 | (6.27%) | 16.19% | 70.20% |
| FX Rate | 1.3252 | 1.3472 | 1.67% | 0.01% | 5.89% |
| Unit Price $ | 2.4062 | 2.2929 | (4.71%) | 16.20% | 80.22% |
| CAGR £ | 26.99% | 22.88% | (4.11%) | 1.86% | 22.88% |
It was a poor month as our investments lost just over (6%). The FX rate to see what we’re worth in USD came to our rescue a little and so overall, The Crazy Fund lost just under (5%) in USD over the month.
Losing money is never easy and therefore it’s important to look at how far we have come since we started rather than focusing on a single month where we lost money. We’ve developed great money habits which have set us on course to a bright financial future. We expect months like this, they’re just volatility and the price to pay to earn the returns needed to create wealth. We’re on track and must not let volatility push us off course.
Below is a table of what the fund is invested in at 31/July:
| Ticker | % Fund | Price | CCY | Type | Description |
| LON:CSP1 | 9.4% | 59,475.00 | GBP | ETF | iShares Core S&P 500 UCITS (Acc) GBP Hedged |
| LON:JAM | 9.4% | 1,200.00 | GBP | IT | JP Morgan American Investment Trust PLC |
| LON:EQQQ | 9.4% | 50,953.00 | GBP | ETF | Invesco NASDAQ 100 UCITS GBP Hedged |
| LON:IITU | 9.9% | 3,553.00 | GBP | ETF | iShares S&P 500 Information Technology |
| LON:XDWT | 10.0% | 134.86 | USD | ETF | Xtrackers MSCI World Information Technology UCITS |
| LON:ATT | 10.4% | 670.00 | GBP | IT | Allianz Technology Trust PLC |
| LON:PCT | 11.7% | 626.50 | GBP | IT | Polar Capital Technology Trust PLC |
| LON:SMT | 9.6% | 1,330.50 | GBP | IT | Scottish Mortgage Investment Trust PLC |
| LON:OCI | 10.3% | 520.00 | GBP | IT | Oakley Capital Investments Limited |
| LON:XDEM | 9.7% | 7,042.00 | GBP | ETF | DB X-Trackers MSCI World Momentum Factor UCITS |
| Shares | 99.9% | ||||
| Cash | 0.1% |
There were no dividends received in the month and no other changes to the portfolio.
A FAVOUR
If you find our posts helpful in building a bright financial future then in exchange, please sign up to receive them by email. The more people that subscribe the more we grow which means we can create more content to help you become unimaginably wealthy. You can sign up using the subscribe box at the top of our website: https://thecrazyplan.com
*** Please spread the word!
This blog is free as we want everyone to have access to financial education. We hope to inspire you to set out on your own journey to a bright financial future and if we do, in return please spread the word to others.
NEXT MONTH
Next month we’re going to look at how to put a watchlist together. What we’ll see is an excuse to give up because things can get pretty complicated. The last time we had an excuse to give up was when we looked at investing small amounts back in post “1.8 Investing Small Amounts & Correlation.” If you remember, we couldn’t afford to buy shares in CSP1 as we didn’t have enough money for even a single share! In that post, we came up with a solution instead of giving up and next month we’ll have to do the same thing for building a Watchlist.
DISCLAIMER
Please note that by the time this blog is published, we may no longer own some or any of the investments discussed. Strategies and investments discussed might be totally unsuitable for you and we are not recommending them to you, they should only be considered as ideas for further research. You must read and agree to our Terms & Conditions, including the Disclaimer, which can be found on the T&C page of our website: https://thecrazyplan.com
© TradeFloor Promotions Limited 2026

