May 2026
WELCOME
Welcome to The Crazy Plan where our mission is to show that anyone can create unimaginable wealth.
Each month, we publish a blog providing readers with the financial education needed to set out on their own journey to a bright financial future. We do this by following two plans, our Monthly Plan saves £50 a month for 10 years and our Lumpsum Plan starts with a one-off £10,000. Our aim is to turn each plan into $1 billion in one or two generations.
At first, making $1 billion seems crazy but once you realise it’s a journey then things change. We’ll save our first £50 and from there our wealth will build to $1,000, then $5,000, then $10,000 and then $50,000. One day, if we’re patient, we’ll have $100,000 and then we’ll be looking at $1 million. From there it will be onwards to our $1 billion goal. This journey of small steps is how what seems impossible becomes possible.
You can dig-in to our posts however you like or if you are completely new to investing, you may want to start with “1.0 Liftoff!” and go through them in order which is how we build the education. We hope to provide you with the knowledge needed to set out on your own journey to a bright financial future if you choose. You can also visit the “About” page on our website to learn more about our plan.
All readers must read and agree to our Terms & Conditions, including the Disclaimer, which can be found on the T&C page of our website: https://thecrazyplan.com
ON WITH THE PLAN
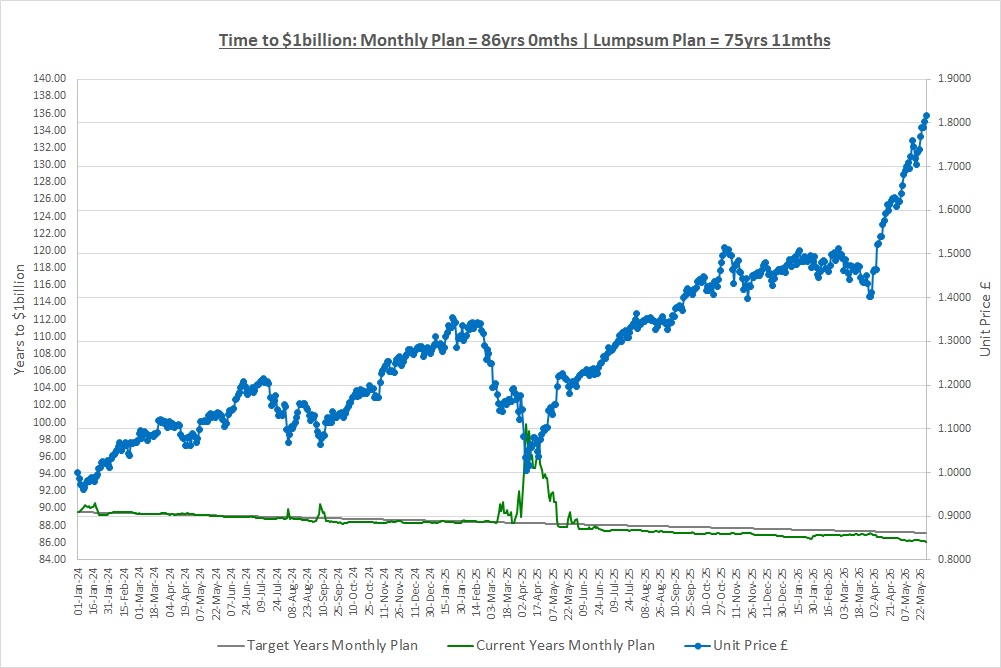
Our Lumpsum Plan will be worth $1billion in: 75yrs 11mths
Our Monthly Plan will be worth $1billion in: 86yrs
Please subscribe for free to receive our posts by email using the Subscribe box at the top of our website.
Milestone! The Lumpsum Plan has broken the 76-year barrier to reach $1 billion.
It’s been another extremely strong month and as a result, the Lumpsum Plan has broken through the 76-year mark to reach $1 billion for the first time. The Monthly Plan also benefited of course as it holds units in The Crazy Fund and is now on the cusp of breaking the 86-year barrier for the first time. These milestones are our motivation to remain committed to our plan.
Last month we talked about Private Equity which is investing in companies that are not listed on stock markets. We can invest in Private Equity funds as we did with OCI or in funds that allocate part of their capital to private companies like SMT with its holding in Space X. We also performed our quarterly portfolio review resulting in us replacing IEM with OCI. This month we’re going to cover the basics of how to find a fund that we might want to invest in.
OPTIONS FOR CHOOSING FUNDS
There many ways to choose a fund but there are three core ones to think about to start with, or four if we randomly throw darts!
Firstly, we could look at all the companies a fund owns and research each company and see if we like what the fund is invested in. This is essentially investing in single stocks but with someone giving us a short-list to start with. This is not something we’re going to do as it will take far too long and we might not be any good at it anyway as we discussed in post “1.1 Choosing Companies to Invest In.”
The second way is to read a fund’s investment strategy and see if we like the sound of what they do. The problem is that every fund will have an incredible investment strategy, who would run a fund and put out a terrible strategy?! We saw this in “3.3 Choosing a Fund: Beginnings” where we went to a slick investor conference, saw the shiny website and then looked at the performance of the fund versus a rather un-shiny Berkshire Hathaway. So, starting with the investment strategy doesn’t work for us either.
Finally, we could start by looking at how a fund has performed in the past (for example 10 years) and that’s our approach. When we do this, we’re comparing funds over the same 10 years so the same market conditions. Some funds will have done well and some poorly so we can look for ones that did the best over the period. Note that there’s a potential problem here as if an investment style, such as value investing, was in vogue over the period it might stop performing going forwards but we’ll pick this point up in future posts.
LESSONS FROM DRIVING INSTRUCTORS
We’re going to quickly revisit Sandra and Bob from post “3.2 Choosing a Driving Instructor: Yes, really!” when we were trying to pick a driving instructor and see if there are any lessons we can apply to picking a fund.
Sandra And Bob – Part 2
When trying to find a driving instructor we asked the question “Are they any good at their job?” We found that Sandra had a pass rate of 70% whereas Bob’s was 45% so we called Sandra. We’ll now throw a spanner in the works because what if it was the wrong decision? If we had stopped for a moment and dug a little deeper, what if we found the following pass rates over time?
| Years | Yr 1 | Yr 2 | Yr 3 | Avg |
| Bob | 20% | 45% | 70% | 45% |
| Sandra | 80% | 75% | 55% | 70% |
It turns out that Bob bought the school 3 years ago when it was a mess and has worked hard to improve it. He bought new cars, set up the app, bought the simulator and improved instructor training. As a result, he’s taken the pass rate from 20% to 70% last year. Sandra on the other hand has seen her pass rate drop to 55% from 80% 3 years ago.
So, now the question of “Are they any good at their job?” becomes a lot more difficult and this is exactly the problem we face when trying to pick funds. As we’ll now see, we can’t just look at the CAGR of a fund as it might not give the whole story.
WHAT ARE WE TRYING TO ACHIEVE?
When we ask the question “Are they any good at their job?” what we need to do is understand what “good” means. With hindsight, “good” means the best return as if we could invest with hindsight, we would always take the highest return. However, we can’t invest with hindsight and so “good” also needs to answer the question “…and do we think they will continue to be any good?” Let’s look at three funds with the following CAGRs over the last 10 years: Spike 16%; Step 15%; and Slope 14%
Initially, we’re drawn to Spike just as we were drawn to Sandra as Spike made the highest return of 16%. However, is Spike the fund we want to be invested in going forwards? Let’s have a look at the time-series (just a fancy word for history) of their prices:
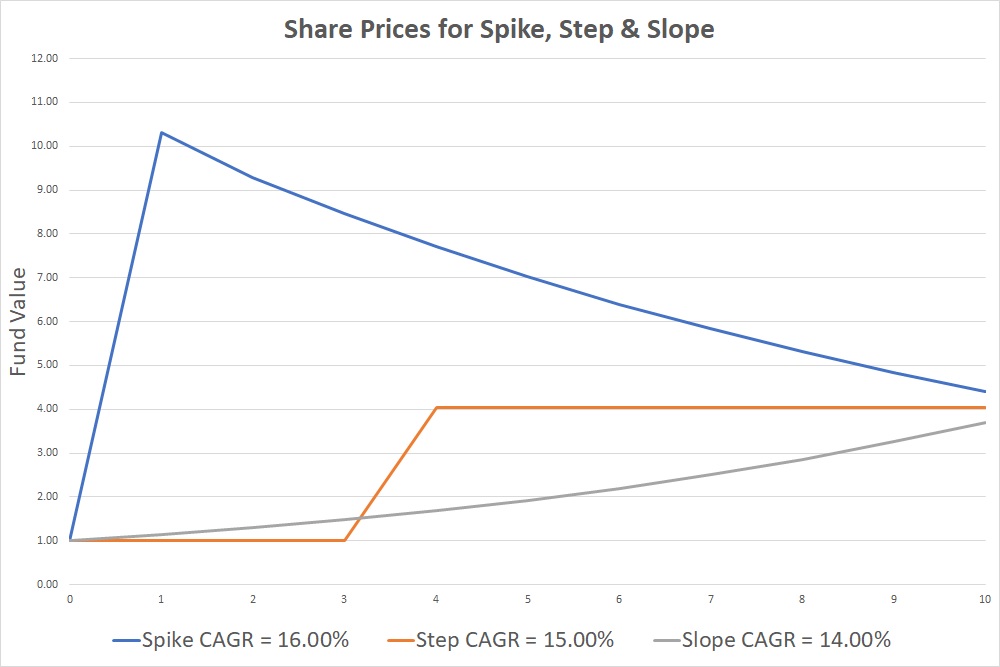
It’s extremely hard to not be drawn to Spike as it dominates the chart and its return was the best at 16% but we need to be extremely careful. Spike had one massive year then lost money every single year for the next nine years. Is Spike a good fund? Likewise, Step made a huge return in its fourth year but zero in the other nine years. Step is better than Spike as at least it hasn’t been losing money in the other years but even so, what confidence do we have that if we invest in Spike or Step, we’ll make a return next year? The answer is absolutely none.
Contrast this with Slope which has just been quietly making money year after year, in fact it made 14% every single year. If we invest in Slope, we have a much higher confidence that we’ll make money going forwards as the fund manager has consistently made solid returns year after year after year.
We will repeat, it’s extremely easy to be drawn to Spike as it dominates the chart and has the highest return but that doesn’t mean it’s the best fund to invest in. The time-series reveals that Slope is a consistent fund that will maximise our chances of earning a solid return and achieving our goal.
In the real world of course, these comparisons are not so simple as the difference in CAGRs can be large and the time-series can be very volatile so we’ll have to make trade-offs. Our job though is to not be pulled in just by CAGR, we need to find funds that increase our chance of achieving our goal, funds like Slope.
FOUR CORE METRICS TO MONITOR
So, what qualities are we going to look for in a fund? Well, we’re going to focus on four core metrics of a fund’s historic performance. The great thing is that we’ve already looked at three of these metrics when we performed our quarterly portfolio reviews and the metrics are:
- The return, so CAGR;
- The consistency of the return;
- Drawdowns; and
- The length of drawdowns.
Our aim is to come up with a number to describe each of these so we can compare them across funds as this will make our life a whole lot easier. We’re going to calculate these metrics over 10 years, just as we’ve done for our portfolio reviews.
CAGR
To state the obvious, we want our investments to make money so our first metric is CAGR. This is going to be a key input to our decision to invest but it won’t be the only input. The great thing about CAGR is that we can compare it across funds.
Consistency of CAGR
As we’ve just seen, CAGR can be misleading if a fund had one fantastic year. To counter this we’ll look at the worst five annual returns of a fund and this will be our second metric to evaluate a fund.
Way back in post “1.3 CAGR & Crazy Plans” we talked about “BEWARE THE AVERAGE TRAP” and said it’s dangerous to average returns as returns compound, they don’t average. For this reason, we won’t average the five worst returns but we’ll compound them (multiply them together) and then calculate the CAGR. By calculating this metric as a CAGR we can compare across funds. Let’s quickly calculate the CAGR of the five worst returns for ATT, one of the research ideas in The Crazy Fund:
| Wst Yr | Return | Start £ | End £ |
| 1 | (12.02%) | 1.00 | 0.88 |
| 2 | 8.15% | 0.88 | 0.95 |
| 3 | 11.39% | 0.95 | 1.06 |
| 4 | 16.85% | 1.06 | 1.24 |
| 5 | 23.31% | 1.24 | 1.53 |
| Avg: | 9.54% | CAGR: | 8.84% |
The worst annual return was a loss of (12.02%) so if we’d invested £1 it would have been worth only £0.88 at the end of the year. The second worst annual return was +8.15% and so if we had invested the £0.88 we had after the worst year, we would have ended up with £0.95 at the end of the second year (£0.88 * (1 + 8.15%) = £0.95). If we keep doing this then after the five worst years, we would have ended up with our initial £1 being worth £1.53 as you can see in the table.
So, what is the CAGR needed to turn £1 into £1.53 over 5 years? It’s 8.84% as this is the return you would need to earn every year for 5 years as follows:
£1 * (1 + 8.84%) * (1 + 8.84%) * (1 + 8.84%) * (1 + 8.84%) * (1 + 8.84%) = £1.53
Note that the CAGR is less than the average return of 9.54% and that’s why we compound and don’t average returns as we would earn the CAGR if we actually invested. If you want to know the maths to go from £1.53 to the CAGR then it’s called a 5th root as we’re using 5 years of returns. The formula is CAGR = 1.53^(1/5) – 1. If you’re not sure on this then re-read post “1.3 CAGR & Crazy Plans” and do some research online as knowing how to calculate CAGRs is really useful and should be in your toolkit.
In reality, these worst years probably didn’t all come in a row so is it correct to assume they did? Well, they are all part of the 10-year CAGR and so by compounding them we’re seeing their impact on the overall CAGR for the 10 years and that’s what we want. This metric is comparable across funds as it’s a CAGR which is what we need.
Drawdowns
Our third metric is going to be drawdown. We’ve already looked at this when we reviewed our portfolio as we looked at the average of the five worst drawdowns over the 10-year period and that’s the metric we’ll calculate. If we have two funds that make the same returns from year to year but one fund had large drawdowns we’d prefer the fund with smaller drawdowns. This metric is comparable across funds as it’s a percentage loss from the peak wealth. We discussed this in post “2.8 Stock Market Volatility: Drawdowns.”
Length of Drawdowns
Our fourth and final metric is going to be the length of drawdowns since all things being equal, we would prefer a fund with shorter drawdowns. Again, we’ll take the five longest drawdowns and average them and as the metric is in days, it’s again comparable across funds.
FOUR CORE METRICS OF A FUND’S PERFORMANCE
So, what do these four metrics of performance look like for the research ideas in The Crazy Fund?
| Ticker | CAGR | WRTN.CAGR | DD.Avg | DDT.Avg |
| PCT | 28.01% | 6.89% | 28.79% | 214 |
| ATT | 27.99% | 8.84% | 33.85% | 243 |
| IITU | 27.35% | 16.61% | 22.41% | 169 |
| XDWT | 23.99% | 10.78% | 26.68% | 184 |
| EQQQ | 22.09% | 11.74% | 21.24% | 198 |
| SMT | 18.89% | (2.10%) | 31.34% | 334 |
| XDEM | 16.55% | 7.42% | 18.83% | 219 |
| CSP1 | 16.39% | 8.11% | 17.89% | 165 |
| JAM | 15.72% | 3.71% | 22.71% | 207 |
| OCI | 12.52% | (0.45%) | 24.54% | 199 |
Key: WRTN = Worst Return, DD = Drawdown, DDT = Drawdown Time in business days
Notes: Metrics for 10 years ending 15/05/2026, Capital return only (no dividends), Constant FX rates
We realise this table poses more questions than it answers: Why did we add OCI last month when it has a lower return than the other research ideas? Why do we keep SMT when it’s had such large drawdowns? What are the five worst returns / drawdowns / drawdown lengths? How much weight should we give to each of the four metrics?
One thing we do know however is that the table gives clear, factual information about how funds have performed in the past which is a great start. The answers to the questions will depend on each investor and some people will want to focus on funds with smaller and shorter drawdowns whereas others will want to focus on higher returns at the expense of drawdown.
The fact that we can compare across funds is extremely powerful as if we’re interested in a new fund, we can calculate the same four metrics for it and compare it to funds we already have on our watchlist. Not only that, we can calculate the same metrics for a portfolio and see how individual funds work together in a portfolio. This is what we’ll do when we start to look at how to build a portfolio.
FURTHER RESEARCH
Now we have our four key metrics, we can use them to direct our research. For example, if we don’t like large drawdowns we can look at funds that keep the worst five to less than 25% so we can immediately eliminate ATT, PCT, SMT and XDWT. Now we can go to the remaining funds’ websites and research their investment strategies, holdings and other information.
The important thing is that we’re starting our research by selecting funds that meet a certain standard so we’ll not be persuaded by the shiny website, slick investor conference or great CAGR that was a one-hit wonder like Spike or Step. We have a way to look at historic performance and use it to guide further research.
CONCLUSION
“Sandra and Bob – Part 2” shows how important it is to dig a little deeper. With funds, we can start by calculating four key metrics that describe a fund’s performance in terms of return, consistency of return, drawdowns and length of drawdown. We’ve calculated each of these in a way that allows us to compare them across funds which is extremely powerful and allows us to quickly find funds to research.
Don’t forget that when we invest in a fund, we’re giving our money to a professional investment manager to do all the hard work for us. The question we need to ask is “Have they been any good at making money and are they likely to continue to make money in the future?” Starting with our four metrics allows us to quickly narrow down the field and start on solid ground.
Yes, we may miss a fund that performed poorly and turns around its performance but on average, we believe this approach will allow us to have that all important “cake” we talk about and that’s what we need to achieve our goal of $1 billion. We’ll look at the icing when we talk about building a portfolio but the cake is found by finding solid funds in the first place to build a portfolio from.
This is not the only way to research funds of course, there are plenty more and some will be far better than our approach. However, for us, starting with how a fund has historically performed using these four metrics builds strong foundations and maximises our chances of getting that all important cake.
THE INVESTMENT REPORT
For an explanation of The Investment Report and The Crazy Fund please see our post “1.1 The Deep End”
| Fri 29-May-26 | Monthly Plan | Lumpsum Plan |
| Cash last month £ | 205 | 0 |
| Cash Saved £ | 50 | 0 |
| Unit buys / sells £ | 0 | 0 |
| Total Cash £ | 255 | 0 |
| Units last month | 930 | 10,000 |
| Units bought / sold | 0 | 0 |
| Total Units owned | 930 | 10,000 |
| Unit Price £ | 1.8160 | 1.8160 |
| Fund Value £ | 1,689 | 18,160 |
| Total Wealth £ | 1,944 | 18,160 |
| FX Rate | 1.3453 | 1.3453 |
| Total Wealth $ | 2,616 | 24,431 |
| Estimated CAGR | 15.00% | 15.00% |
| Years to $1billion | 86yrs 0mths | 75yrs 11mths |
We’ve been saving diligently on the Monthly Plan and are one month away from buying units in The Crazy Fund. We really are now building wealth, it’s incredible how far we’ve come having started at zero just over two years ago. If you can save more than £50 a month then do, some say you should save 20% to 30% of your income. If you can’t save £50 yet then save whatever you can, even if it’s just £5. No matter what you do, make sure you never break the savings habit and regularly increase the amount when you can.
THE CRAZY FUND
| Results | 30-Apr-26 | 29-May-26 | MTD Move | YTD Move | LTD Move |
| Unit Price £ | 1.6199 | 1.8160 | 12.11% | 23.97% | 81.60% |
| FX Rate | 1.3546 | 1.3453 | (0.69%) | (0.14%) | 5.74% |
| Unit Price $ | 2.1943 | 2.4431 | 11.34% | 23.81% | 92.02% |
| CAGR £ | 23.01% | 28.10% | 5.09% | 7.08% | 28.10% |
It’s been another exceptional month with the portfolio making 12%. This will not continue, we will suffer a large drawdown at some point and / or years of very low returns but we have no idea when those periods will come. We remain invested with an extremely long-term view and will keep doing our research to build the best portfolio we can.
Below is a table of what the fund is invested in at 29/May:
| Ticker | % Fund | Price | CCY | Type | Description |
| LON:CSP1 | 9.0% | 60,540.00 | GBP | ETF | iShares Core S&P 500 UCITS (Acc) GBP Hedged |
| LON:JAM | 8.9% | 1,218.00 | GBP | IT | JP Morgan American Investment Trust PLC |
| LON:EQQQ | 9.5% | 55,032.00 | GBP | ETF | Invesco NASDAQ 100 UCITS GBP Hedged |
| LON:IITU | 10.0% | 3,839.00 | GBP | ETF | iShares S&P 500 Information Technology |
| LON:XDWT | 10.1% | 145.11 | USD | ETF | Xtrackers MSCI World Information Technology UCITS |
| LON:ATT | 10.6% | 730.00 | GBP | IT | Allianz Technology Trust PLC |
| LON:PCT | 12.4% | 711.50 | GBP | IT | Polar Capital Technology Trust PLC |
| LON:SMT | 10.3% | 1,522.00 | GBP | IT | Scottish Mortgage Investment Trust PLC |
| LON:OCI | 9.6% | 514.00 | GBP | IT | Oakley Capital Investments Limited |
| LON:XDEM | 9.4% | 7,265.00 | GBP | ETF | DB X-Trackers MSCI World Momentum Factor UCITS |
| Shares | 99.9% | ||||
| Cash | 0.1% |
There were no changes to our portfolio this month and no dividends were received.
A FAVOUR
If you find our posts helpful in building a bright financial future then in exchange, please sign up to receive them by email. The more people that subscribe the more we grow which means we can create more content to help you become unimaginably wealthy. You can sign up using the subscribe box at the top of our website: https://thecrazyplan.com
*** Please spread the word!
This blog is free as we want everyone to have access to financial education. We hope to inspire you to set out on your own journey to a bright financial future and if we do, in return please spread the word to others.
NEXT MONTH
Next month we’re going to put this month’s post into practice by thinking about building a watchlist. Having a watchlist is essential as we need to always be looking to improve and be ready for the situation we had with IEM where we wanted to replace it in our portfolio.
At the end of June, we’ll have saved for 6 months since we last bought units for the Monthly Plan. In early July we’ll buy units in The Crazy Fund with our £300, probably just before the next post is out. If you need a refresher on investing small amounts then the post is “1.8 Investing Small Amounts & Correlation.”
DISCLAIMER
Please note that by the time this blog is published, we may no longer own some or any of the investments discussed. Strategies and investments discussed might be totally unsuitable for you and we are not recommending them to you, they should only be considered as ideas for further research. You must read and agree to our Terms & Conditions, including the Disclaimer, which can be found on the T&C page of our website: https://thecrazyplan.com
© TradeFloor Promotions Limited 2026
