March 2026
WELCOME
Welcome to The Crazy Plan where our mission is to show that anyone can create unimaginable wealth.
Each month, we publish a blog providing readers with the financial education needed to set out on their own journey to a bright financial future. We do this by following two plans, our Monthly Plan saves £50 a month for 10 years and our Lumpsum Plan starts with a one-off £10,000. Our aim is to turn each plan into $1 billion in one or two generations.
At first, making $1 billion seems crazy but once you realise it’s a journey then things change. We’ll save our first £50 and from there our wealth will build to $1,000, then $5,000, then $10,000 and then $50,000. One day, if we’re patient, we’ll have $100,000 and then we’ll be looking at $1 million. From there it will be onwards to our $1 billion goal. This journey of small steps is how what seems impossible becomes possible.
You can dig-in to our posts however you like or if you are completely new to investing, you may want to start with “1.0 Liftoff!” and go through them in order which is how we build the education. We hope to provide you with the knowledge needed to set out on your own journey to a bright financial future if you choose. You can also visit the “About” page on our website to learn more about our plan.
All readers must read and agree to our Terms & Conditions, including the Disclaimer, which can be found on the T&C page of our website: https://thecrazyplan.com
ON WITH THE PLAN
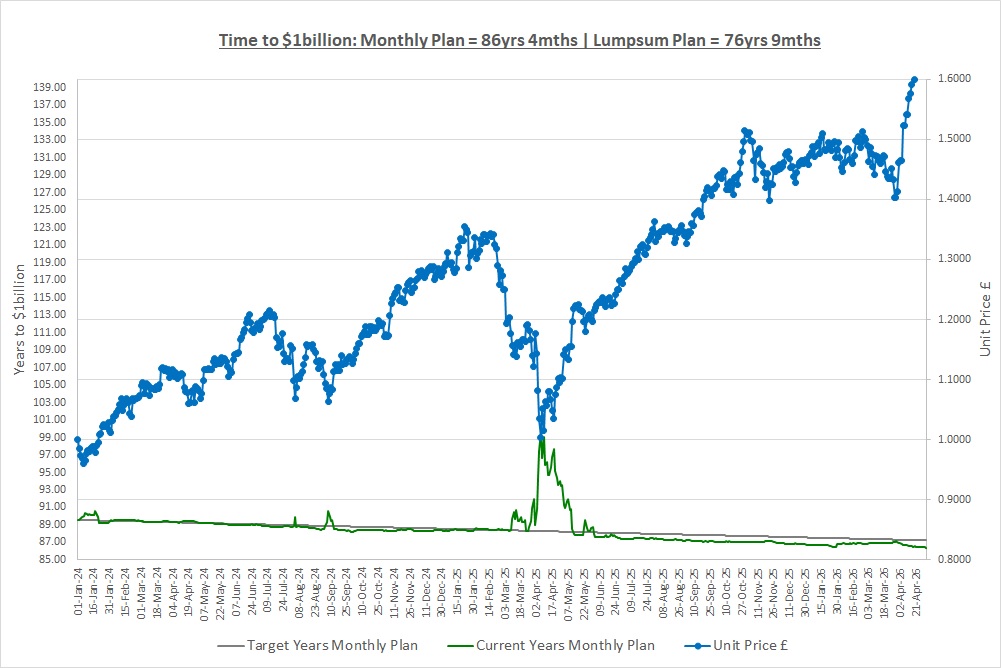
Our Lumpsum Plan will be worth $1billion in: 76yrs 9mths
Our Monthly Plan will be worth $1billion in: 86yrs 4mths
Milestone! The Lumpsum Plan has broken through the 77-year barrier to reach $1 billion for the first time.
It’s incredibly important to celebrate milestones on our journey. It’s all too easy when investing to focus on the drawdowns but it’s the milestones that give us the belief and motivation to stay on our journey to a bright financial future. Perhaps you have just saved your first £50, perhaps you have hit $2,000 of savings, no matter what it is, make sure you celebrate milestones on your journey.
Please subscribe for free to receive our posts by email using the Subscribe box at the top of our website.
Last month we talked about the importance of history when choosing which funds to consider for our portfolio. We took the lesson from how to pick a driving instructor and saw that it’s just as important for picking funds. It doesn’t matter how shiny and polished an investment might look, it’s only when you look at its performance over many years that you can start to see if might be worth investigating. Remember, the key question to ask when choosing a fund is the same as the one for choosing a driving instructor, “Are they any good at their job?”
This month we’re doing our quarterly portfolio review for the second time and as a result we have changed one of our investments as you’ll see. First though we want to just talk about something called Private Equity as the new investment we put into The Crazy Fund this month is in the Private Equity space.
PRIVATE EQUITY
Post “1.5 Companies, Shares & Stocks” seems a long time ago now but if you recall, in that post we talked about incorporating a company to run a business to protect the shareholders from unlimited liability from croissant slipping customers.
We also said that a company structure makes it easier to raise money from other people as issuing shares is relatively simple. As investors though, we still have a problem as unless we know the owners of the business, we have no chance of being able to invest in a private company.
The best current example of a hugely successful company that’s still private is Space X, which was founded by Elon Musk. Space X is reportedly planning an Initial Public Offering (“IPO”) later this year and the valuation? More than $1 trillion and possibly as much as $1.75 trillion. Yes, that’s trillion and do you want to know what its valuation was in 2002? Approximately $27 million! So, who’s going to share in that massive payday?
If a private business needs money to grow and existing shareholders can’t provide it, it has several choices. It could go to the bank and take out a loan, list through an IPO, or find investors who are prepared to own shares in a private company. These investors could be individuals or they could be funds who specialise in investing in private businesses.
These funds are the key to owning shares in private businesses. For example, our research portfolio has Scottish Mortgage Trust (“SMT”) as an investment and its biggest holding is Space X. If you have owned SMT over the last few years then you will have done very nicely from its holding in Space X and its rise to a $1 trillion plus valuation.
There are several layers of providing funding for private companies from funds that invest in really small start-ups (Seed Funding) to small businesses (Venture Capital) to medium and large size businesses (Private Equity). Some of these funds can generate really strong returns over the long-term as they are investing in companies that are in their early and most explosive stages of growth.
So, even though as investors we normally can’t invest directly into private companies, we can invest through funds that focus on Private Equity (and Venture Capital and Seed Funding) or funds that allocate a percentage of their capital to private investments as SMT does. That’s all Private Equity is, investing in businesses that are not listed on the stock market.
PORTFOLIO REVIEW & CHANGE
Last month we faced an extremely complicated situation on our holding in Impax Environmental Markets (“IEM”) due to the vote on a tender offer and the tender offer itself. In the end, we chose to replace IEM in our research portfolio so before the vote, on 15/April, we sold our shares in IEM in the market and added a new investment, Oakley Capital Investments (“OCI”).
Our reasons for this were that we don’t like uncertainty and so we replaced IEM and moved on. In the end, almost 100% of shareholders voted for the tender offer and 78% of shares were tendered to be redeemed at NAV. We decided to sell in the market so that we could immediately buy OCI as the proceeds of the tender offer are not due until the end of May at the earliest.
So how does our new Live.PF with OCI look compared to the Old.PF with IEM? Could we do even better than our new portfolio? Let’s have a look over the last 10 years and see what would have happened if we had gone all the way back and invested 10 years ago with hindsight:
| Result | Live.PF | Old.PF | Overall | CAGR | AvgDD |
| CAGR | 19.62% | 19.16% | 18.83% | 19.87% | 17.95% |
| DD.Avg | 22.76% | 23.53% | 21.12% | 22.30% | 20.28% |
| DD1 | 28.94% | 30.06% | 28.13% | 27.22% | 26.08% |
| DD2 | 27.15% | 28.02% | 23.61% | 26.91% | 23.51% |
| DD3 | 24.50% | 25.60% | 23.16% | 24.41% | 22.84% |
| DD4 | 19.89% | 20.08% | 19.55% | 19.68% | 17.86% |
| DD5 | 13.34% | 13.88% | 11.18% | 13.29% | 11.12% |
| DDT.Avg | 203 | 210 | 173 | 201 | 198 |
| DDT1 | 521 | 554 | 421 | 541 | 517 |
| DDT2 | 160 | 159 | 159 | 160 | 164 |
| DDT3 | 127 | 130 | 119 | 121 | 129 |
| DDT4 | 111 | 109 | 84 | 96 | 97 |
| DDT5 | 97 | 98 | 82 | 86 | 83 |
| £1 in 10 Years | 6.00 | 5.77 | 5.61 | 6.12 | 5.21 |
Key: DD = Drawdown, DDT = Drawdown Time in business days (weekdays excluding holidays)
Note: Capital return only, no dividends included.
New Portfolio
The only difference between the Live.PF and the Old.PF is OCI replacing IEM. If we time-travelled and had owned the new portfolio over the last 10 years we would have improved the CAGR by almost 0.50% to 19.62% and over decades, an extra 0.50% will compound significantly. So, was this extra return at the expense of drawdowns? No, the new portfolio has improved all 5 of the biggest drawdowns over the 10-year period and 3 out of 5 of the longest drawdowns were reduced with the other two hardly changing.
Overall, the move to the new portfolio looks like a win-win on return and drawdown. There is also the fact that our new holding in OCI is in the Private Equity space and until now, we had no exposure to this sector and so diversifying our exposure is no bad thing.
A quick caveat here, what if all the Private Equity investments are in the Information Technology sector and so we are not diversifying? We have a lot of Information Technology in The Crazy fund already and so we could in fact be increasing our exposure. This is something we will come back to in future posts when we move on to more advanced ways to build a portfolio but for now, just be aware that sectors can be misleading as we have previously discussed.
As a result of our review, we decided to replace IEM with OCI but is there a better portfolio we could move to? Back in post 3.1 when we last reviewed our portfolio we concluded by saying that at the end of the day, the important thing was that we have a cake and trying to pick between the above portfolios is the icing. We must not forget this but let’s not be complacent, what does the icing look like?
Overall Portfolio
This portfolio aims to achieve more of a balance of drawdowns and returns. You can see from the table that all drawdowns and drawdown lengths are improved but at the cost of the CAGR the portfolio would have achieved which drops by 0.8%, a sizable drop. The main improvement is the length of time the portfolio was in drawdown with the worst case improving by a massive 100 business days from 521 to 421 days. We would of course have preferred these improved drawdown numbers but the question is, would we have been prepared to have them at a cost of 0.80% to our CAGR?
Best CAGR Portfolio
This portfolio aims to improve the CAGR and is not too concerned about drawdowns. In fact, it improves the CAGR by 0.25% and it also improves almost all of the drawdown statistics apart from a couple of their lengths. Would you move to this portfolio rather than our new live one? It looks like a good idea except there is the issue of costs as changing investments incurs costs and if we only improve the CAGR by 0.25% is it worth it?
Best AvgDD Portfolio
This portfolio focuses on improving the drawdown statistics and does a great job. On average, the five worst drawdowns over the last 10 years have been improved by almost 2.5% with the largest being reduced from 29% to 26%. There is a catch though and that’s the impact on return as the CAGR is a massive 1.7% lower than our new Live.PF. The question is whether you are prepared to give up this much return for the improvement in drawdown?
Other Portfolios
We could of course build other portfolios, perhaps one that targets a 15% return with the smallest and shortest drawdowns possible. Or perhaps we could try and maximize return even further. There are endless possibilities but it’s only by looking at tables such as the one above that we will start to understand the trade-offs and where we feel comfortable.
10 Year Chart of Portfolio Returns
So, what do the portfolios look like over the 10-year time-travelling we have just done?
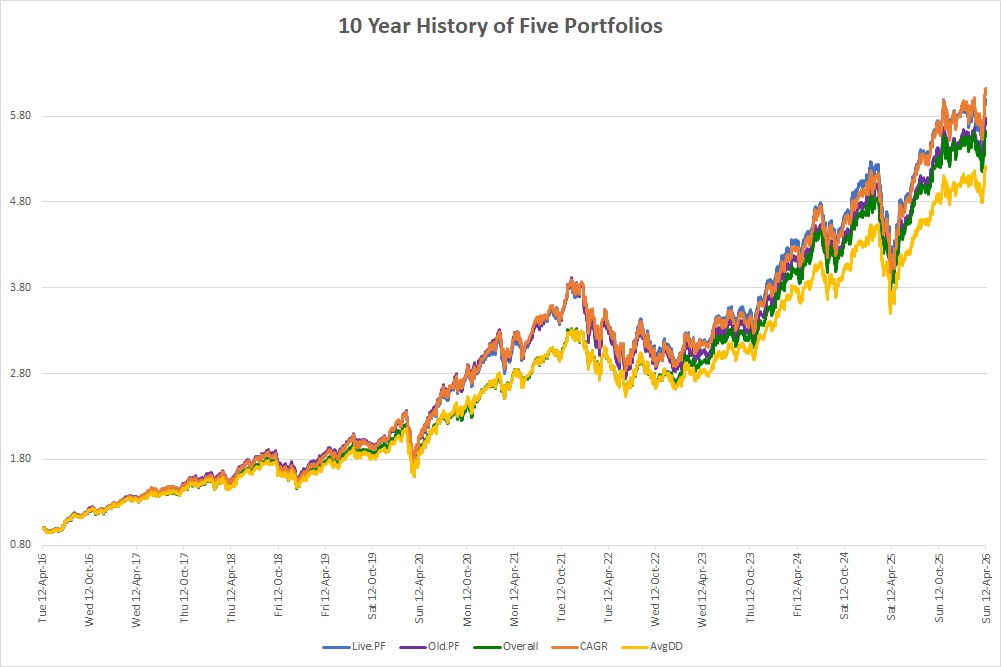
Does this make it any easier? It’s encouraging because yet again, it shows we have a cake. We chose to move to the new Live.PF but there is absolutely no reason that one of the other portfolios would not be acceptable and one of them may, with hindsight, turn out to be better than our choice.
CONCLUSION
We realise that this post has been a repeat of post 3.1 and we still haven’t answered any of the questions raised in that post. The reason is that a lot of the answers can only be found by looking at different portfolios again and again and again. This is only the second time we have gone through this exercise but we will do it many more times so that eventually you look at the table and chart and know almost immediately which portfolio you are pulled towards. You may in fact be pulled towards a portfolio not in the table that has massively improved drawdowns as you are prepared to accept a significantly lower return, it’s up to you. Also remember that this is all time-travelling anyway, we have no idea what the future will bring but it does help to answer the question of “are they any good at their job?”
IEM has shown that we can’t be complacent. We might not have changed investments in our portfolio very often so far, but that doesn’t mean we can sit back and do nothing. We have to prepare for events such as IEM or for what we’ll do if we have a fund that performs poorly. Pouring over the table and chart above might seem as if it isn’t achieving much but the more you do it the more you will start to understand what to look for when building a portfolio.
Remember there is no correct answer, it will only be with hindsight that the “best” portfolio will be known and we guarantee it will not be our portfolio.
THE INVESTMENT REPORT
For an explanation of The Investment Report and The Crazy Fund please see our post “1.1 The Deep End”
| Thu 30-Apr-26 | Monthly Plan | Lumpsum Plan |
| Cash last month £ | 155 | 0 |
| Cash Saved £ | 50 | 0 |
| Unit buys / sells £ | 0 | 0 |
| Total Cash £ | 205 | 0 |
| Units last month | 930 | 10,000 |
| Units bought / sold | 0 | 0 |
| Total Units owned | 930 | 10,000 |
| Unit Price £ | 1.6199 | 1.6199 |
| Fund Value £ | 1,507 | 16,199 |
| Total Wealth £ | 1,712 | 16,199 |
| FX Rate | 1.3546 | 1.3546 |
| Total Wealth $ | 2,319 | 21,943 |
| Estimated CAGR | 15.00% | 15.00% |
| Years to $1billion | 86yrs 4mths | 76yrs 9mths |
Another month rolls by and another £50 saved, consistency of good money-habits is the key to our success. That also goes for the Lumpsum Plan as consistently not being tempted to spend our savings is not to be underestimated! Good habits now will forge the mindset needed to create the bright financial future we are aiming for.
THE CRAZY FUND
| Results | 31-Mar-26 | 30-Apr-26 | MTD Move | YTD Move | LTD Move |
| Unit Price £ | 1.4128 | 1.6199 | 14.66% | 10.59% | 61.99% |
| FX Rate | 1.3209 | 1.3546 | 2.56% | 0.56% | 6.47% |
| Unit Price $ | 1.8662 | 2.1943 | 17.59% | 11.20% | 72.47% |
| CAGR £ | 16.62% | 23.01% | 6.39% | 1.99% | 23.01% |
Last month we were in drawdown and had no idea how large or long the drawdown could be. Little did we know that this month would be our best month since we started with our investments making 14.7%. The FX rate to see what we’re worth in USD also went our way resulting in a total return in USD of 17.6%. This just goes to show how unpredictable investing can be and why patience is vital.
Below is a table of what the fund is invested in at 30/April:
| Ticker | % Fund | Price | CCY | Type | Description |
| LON:CSP1 | 9.4% | 56,689.00 | GBP | ETF | iShares Core S&P 500 UCITS (Acc) GBP Hedged |
| LON:JAM | 9.5% | 1,154.00 | GBP | IT | JP Morgan American Investment Trust PLC |
| LON:EQQQ | 9.5% | 49,084.00 | GBP | ETF | Invesco NASDAQ 100 UCITS GBP Hedged |
| LON:IITU | 9.6% | 3,274.00 | GBP | ETF | iShares S&P 500 Information Technology |
| LON:XDWT | 9.7% | 125.04 | USD | ETF | Xtrackers MSCI World Information Technology UCITS |
| LON:ATT | 10.0% | 613.00 | GBP | IT | Allianz Technology Trust PLC |
| LON:PCT | 11.8% | 603.00 | GBP | IT | Polar Capital Technology Trust PLC |
| LON:SMT | 10.7% | 1,410.00 | GBP | IT | Scottish Mortgage Investment Trust PLC |
| LON:OCI | 10.0% | 478.00 | GBP | IT | Oakley Capital Investments Limited |
| LON:XDEM | 9.6% | 6,675.50 | GBP | ETF | DB X-Trackers MSCI World Momentum Factor UCITS |
| Shares | 99.9% | ||||
| Cash | 0.1% |
As discussed, during the month we replaced IEM with OCI. We did this by selling our holding in IEM and adding the proceeds to our small cash balance that had built up from dividends received over the last few months. We then invested this total amount in OCI but did not rebalance our portfolio back to equal weights.
Dividends added to our cash balance this month were:
JAM went ex-Div on 16/Apr and will pay on 29/May.
A FAVOUR
If you find our posts helpful in building a bright financial future then in exchange, please sign up to receive them by email. The more people that subscribe the more we grow which means we can create more content to help you become unimaginably wealthy. You can sign up using the subscribe box at the top of our website: https://thecrazyplan.com
*** Please spread the word!
This blog is free as we want everyone to have access to financial education. We hope to inspire you to set out on your own journey to a bright financial future and if we do, in return please spread the word to others.
NEXT MONTH
Next month we’re going to pick up where we left off a month ago and go back to looking at how to pick funds to put on our shortlist of investments, which is where OCI came from. This is the foundation of how to build a portfolio and so we will spend some time thinking about several factors that we might want to consider.
DISCLAIMER
Please note that by the time this blog is published, we may no longer own some or any of the investments discussed. Strategies and investments discussed might be totally unsuitable for you and we are not recommending them to you, they should only be considered as ideas for further research. You must read and agree to our Terms & Conditions, including the Disclaimer, which can be found on the T&C page of our website: https://thecrazyplan.com
© TradeFloor Promotions Limited 2026
