March 2026
WELCOME
Welcome to The Crazy Plan where our mission is to show that anyone can create unimaginable wealth.
Each month, we publish a blog providing readers with the financial education needed to set out on their own journey to a bright financial future. We do this by following two plans, our Monthly Plan saves £50 a month for 10 years and our Lumpsum Plan starts with a one-off £10,000. Our aim is to turn each plan into $1 billion in one or two generations.
At first, making $1 billion seems crazy but once you realise it’s a journey then things change. We’ll save our first £50 and from there our wealth will build to $1,000, then $5,000, then $10,000 and then $50,000. One day, if we’re patient, we’ll have $100,000 and then we’ll be looking at $1 million. From there it will be onwards to our $1 billion goal. This journey of small steps is how what seems impossible becomes possible.
You can dig-in to our posts however you like or if you are completely new to investing, you may want to start with “1.0 Liftoff!” and go through them in order which is how we build the education. We hope to provide you with the knowledge needed to set out on your own journey to a bright financial future if you choose. You can also visit the “About” page on our website to learn more about our plan.
All readers must read and agree to our Terms & Conditions, including the Disclaimer, which can be found on the T&C page of our website: https://thecrazyplan.com
ON WITH THE PLAN
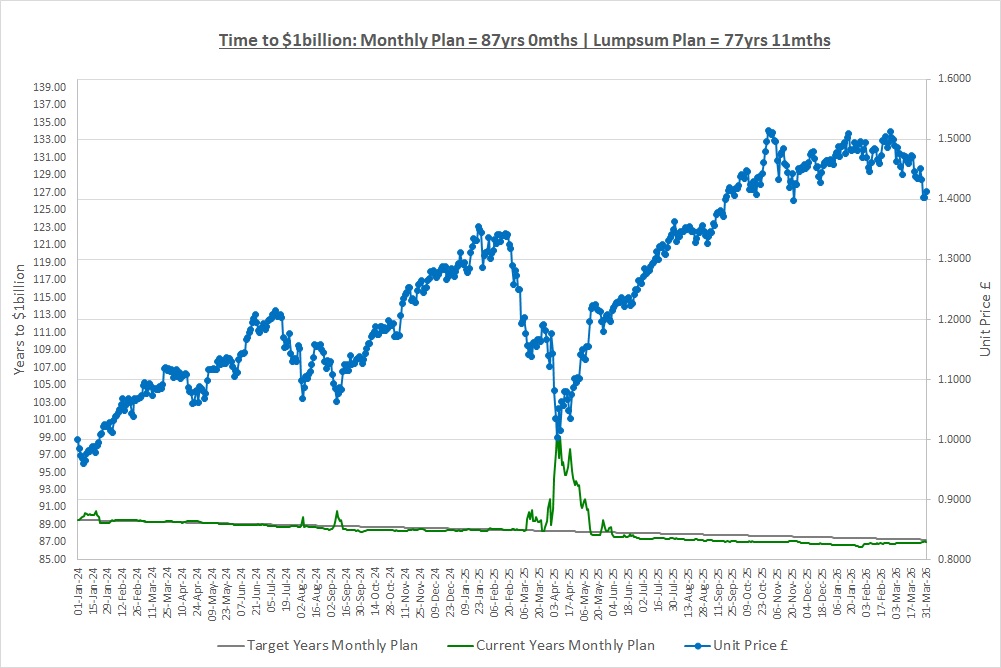
Our Lumpsum Plan will be worth $1billion in: 77yrs 11mths
Our Monthly Plan will be worth $1billion in: 87yrs
Please subscribe for free to receive our posts by email using the Subscribe box at the top of our website.
Last month we took a break from investing (or so it seemed) and looked at how to pick a driving instructor. If you remember, Sandra was a solo instructor with a beaten-up old car, no website or app, rubbish on the back seat and scruffily dressed. Bob ran a big school with 30 instructors, brand new cars, a slick website and app, driving simulators and a really flexible booking and cancellation system. On the surface, Bob was a no-brainer right up until our friend asked “Are they any good at their job?” It turned out that Sandra’s pass rate was 50% higher than Bob’s and that changed everything, we called Sandra.
This month we’re going to take the key lesson, that history can be more insightful than appearances, and start to think about how this applies in the world of investing. First though, we’re going to take a quick look into the stock market crystal ball and talk about volatility.
THE STOCK MARKET CRYSTAL BALL
As you’ve probably worked out by now, we don’t comment on what’s happening in the news and to stock markets as we have absolutely no idea what will happen in the short-term. As you will see later in this post, our investments have lost money this month and we’re in a drawdown and if you are new to investing, you might think this is risk and understandably be extremely concerned.
Our crystal ball has some good news however as it predicts that in 20 or 30 years’ time this current sell-off will be a blip on the chart of stock markets. We’ve seen that for the last 150 years markets have marched relentlessly higher at a 10% CAGR in the US. There have been wars, inflation, recessions, pandemics and all manner of events that have caused temporary sell offs but in every single case, markets have eventually bounced back and marched to new highs.
At 10% a year for 30 years, $1 becomes $17.45 which is a return of 1,645%. Viewing drawdowns of 10%, 30% or even 50% from the perspective of making 1,645% shows them for what they are, volatility. Does this make them easier to live through? With time, as you have lived through several, perhaps, but they are still frustrating. Of course, there is no certainty that current events will prove to be temporary as they could lead to a permanent loss but 150 years of history is a long time to guide us.
During drawdowns it’s really important to remind ourselves about some key aspects of investing and so a review of the following posts is well worth while:
- 2.4 Risk & Volatility
- 2.7 Stock Market Returns: Long Term CAGR
- 2.8 Stock Market Volatility: Drawdowns
Right, let’s get on with seeing how choosing a driving instructor can help with choosing a fund!
AN INVESTOR CONFERENCE
We recently went to an investor conference run by the fund manager of an investment trust. If you remember, the fund manager is responsible for choosing which investments the fund owns and does this on behalf of the shareholders in the case of Investment Trusts.
The fund manager running the event manages several funds and employs hundreds of people. They have a really wonderful website for investors and publish research material, highlight their top ideas for future stocks, post podcasts and video interviews with managers and put up an incredible amount of information.
The event we attended was just as impressive, lasting around three hours and being held in a wonderful conference hall in central London. It started with a tea, coffee and cake reception before we moved into the auditorium. The presentation was incredibly professional with the slides being professionally put together and they contained a great deal of information that really supported the investment case. The story laid out was compelling and the presenter told how the investment managers are focused on identifying the best companies in the world in the best markets to maximise investor returns.
After the presentation there was a drinks reception with canapes and shareholders had the opportunity to meet the fund managers and client relationship managers. It was open floor for questions and the answers were polished and aligned with the investment rational the presentation laid out. We headed home with the fund being top of our list to invest in the next morning.
BERKSHIRE HATHAWAY
If you remember, Berkshire Hathaway is the company that Warren Buffett created and he is worth around $150 billion and he made it all from investing in the stock market through Berkshire. Now, Berkshire is not a fund, it’s a conglomerate, which means it owns lots and lots of companies and in the case of Berkshire it owns around 70 main companies and it also owns around 700 other smaller investments as well as some major investments in listed companies. So, for our purposes, it’s essentially like a fund.
If you take a quick look at Berkshire’s website you’ll see it’s not one of slickest out there (no guesses who we modelled our website on!) It’s essentially a library of black and white word documents with no videos, no podcasts, no communications with shareholders apart from an annual letter and legally required documents and there’s absolutely no effort made to make the site appealing. How many employees are there at head office where all the investment decisions are made? 27. Yes that’s right, just 27 and only one of those actually makes the investment decisions and that was, until he retired last year, Warren Buffett.
OUR SANDRA v BOB MOMENT
So, we woke up after the investor conference and were itching to buy the fund that had been presented to us the night before and found ourselves at our very own investing “Sandra v Bob” moment. Everything lined up including: the wonderful website; the professional conference; the comprehensive presentation; and the investment thesis behind the fund. Conversely, looking at Berkshire’s website didn’t exactly scream INVEST IN US!
However, before investing we asked ourselves that all important question:
“Are they any good at their job?”
We did some research and looked at the CAGRs over the last 10 years and what we found was just like the pass-rates of Sandra and Bob…
- CAGR 8% The Fund
- CAGR 14.4% Berkshire
Now, don’t get us wrong, 8% is a solid return and it comfortably beat inflation over the period and so we would have grown wealthy if we had invested in the fund. However, let’s just look at how much £1,000 would be worth in 50 years’ time at these two rates:
- £1,000 becomes £46,902 @ 8%
- £1,000 becomes £834,260 @ 14.4%
We think you’ll agree that this is a quite simply staggering difference and we know which outcome we’d rather have. At the end of 2025, Berkshire has in fact returned a staggering 19.7% CAGR over the 60 years since 1965 and all this with a website that gives absolutely no clue as to how good the manager of your investment is.
The difference that return makes over long periods of time is quite simply unimaginable as once compounding really starts to kick in it’s like rocket fuel and so in case you’re wondering, over 50 years:
- £1,000 becomes £8,029,852 @ 19.7%
That’s right, over £8 million compared to £46,902 at 8%. The lesson to learn is that just like Sandra’s car was no indication of her pass rate, a slick investment website, investor event and presentations are no indication as to whether the investment manager is any good.
WHY ARE WE INVESTING?
The traditional approach for picking investments is that you should look at the investment process the fund manager uses, who the investment team is and a whole bunch of other factors about the investment approach. Perhaps people who do this would pick Bob as a driving instructor, we don’t know, but what we do know is that history is extremely enlightening. Let’s just ask a few simple questions:
Q: Why are we investing in stocks in the first place?
A: Because we want to grow our money by more than inflation and we believe that stocks will achieve this.
Q: Why have we picked stocks as our investment asset?
A: Because there is 150 years of HISTORY showing a relentless 10% CAGR decade after decade as we saw in post “2.7 Stock Market Returns: Long Term CAGR.”
Q: What does 10% a year mean?
A: It means that people who own businesses make profits, on average, of 10% a year which does not seem unreasonable given the risk they take that the business might go bust.
So, the foundation of our whole investment approach is the fact that the S&P500 has made 10% a year HISTORICALLY for 150 years. If we don’t believe in looking at history then why-on-earth are we investing in stocks in the first place?
CONCLUSION
We all know the saying “Never judge a book by the cover” and yet what do we all do most of the time? We let outward appearances affect our decision making as it’s really, really hard to not be influenced by slick packaging and this is just as true when investing as it is when shopping.
For us, when picking funds, looking at historical performance is the first step to finding possible investments. This is because when we’re picking a fund what we’re really doing is asking the question “Are the fund managers any good at their job?”
We’re not picking a single stock where we should be looking at the company’s financial information, the market they operate in, what the future might hold for their products or services and all the other things we talked about in post “1.10 Choosing Companies to Invest In.”
When we buy a fund we’re delegating all of that work to the fund manager and the best way to see if the people who are managing our money are any good is to see how they have performed in the past. This is just like choosing a driving instructor, we don’t care how shiny the fund manager’s website is or how amazing their investor conference is or what their investment approach is. What we care about is whether they’re any good at their job and as a starting point, their performance history is extremely revealing.
THE INVESTMENT REPORT
For an explanation of The Investment Report and The Crazy Fund please see our post “1.1 The Deep End”
| Tue 31-Mar-26 | Monthly Plan | Lumpsum Plan |
| Cash last month £ | 105 | 0 |
| Cash Saved £ | 50 | 0 |
| Unit buys / sells £ | 0 | 0 |
| Total Cash £ | 155 | 0 |
| Units last month | 930 | 10,000 |
| Units bought / sold | 0 | 0 |
| Total Units owned | 930 | 10,000 |
| Unit Price £ | 1.4128 | 1.4128 |
| Fund Value £ | 1,314 | 14,128 |
| Total Wealth £ | 1,469 | 14,128 |
| FX Rate | 1.3209 | 1.3209 |
| Total Wealth $ | 1,941 | 18,662 |
| Estimated CAGR | 15.00% | 15.00% |
| Years to $1billion | 87yrs | 77yrs 11mths |
Slowly, over time, wealth is built through consistently repeating good money habits. For both plans, the future is looking remarkably different to how it did when we started out two years ago. We’re now starting to have some wealth and every month that goes by is another step on our journey to a bright financial future.
THE CRAZY FUND
| Results | 27-Feb-26 | 31-Mar-26 | MTD Move | YTD Move | LTD Move |
| Unit Price £ | 1.4992 | 1.4128 | (5.77%) | (3.56%) | 41.28% |
| FX Rate | 1.3489 | 1.3209 | (2.08%) | (1.95%) | 3.82% |
| Unit Price $ | 2.0223 | 1.8662 | (7.72%) | (5.44%) | 46.68% |
| CAGR £ | 20.62% | 16.62% | (4.00%) | (4.40%) | 16.62% |
It was a poor month with our investments losing almost (6%) and the FX rate to see what we’re worth in USD also moving against us for a total loss of almost (8%). We are in a drawdown as the chart shows and we have no idea how deep or long it will be. We must keep up our good money habits and remind ourselves that we are on plan and as the green line shows as our CAGR is 16.6% since we started compared with our target of 15%.
Below is a table of what the fund is invested in at 31/March:
| Ticker | % Fund | Price | CCY | Type | Description |
| LON:IEM | 10.9% | 406.00 | GBP | IT | Impax Environmental Markets PLC |
| LON:SMT | 10.4% | 1,191.00 | GBP | IT | Scottish Mortgage Investment Trust PLC |
| LON:XDEM | 9.7% | 5,832.00 | GBP | ETF | DB X-Trackers MSCI World Momentum Factor UCITS |
| LON:ATT | 9.5% | 507.00 | GBP | IT | Allianz Technology Trust PLC |
| LON:IITU | 9.4% | 2,809.00 | GBP | ETF | iShares S&P 500 Information Technology |
| LON:PCT | 10.8% | 480.00 | GBP | IT | Polar Capital Technology Trust PLC |
| LON:XDWT | 9.6% | 104.49 | USD | ETF | Xtrackers MSCI World Information Technology UCITS |
| LON:CSP1 | 10.0% | 52,400.00 | GBP | ETF | iShares Core S&P 500 UCITS (Acc) GBP Hedged |
| LON:EQQQ | 9.6% | 43,218.00 | GBP | ETF | Invesco NASDAQ 100 UCITS GBP Hedged |
| LON:JAM | 10.0% | 1,068.00 | GBP | IT | JP Morgan American Investment Trust PLC |
| Shares | 99.9% | ||||
| Cash | 0.1% |
On 12/Mar EQQQ went ex-Div and paid on 19th so we have included this in our cash balance. Otherwise, there were no changes to the portfolio during the month.
LON:IEM: TENDER OFFER
One of the investments to research in The Crazy Fund above is Impax Environmental Markets (“IEM”). IEM has announced a corporate action with two key parts that shareholders need to be aware of. A corporate action is an event that will potentially significantly change the nature of the company and shareholders need to be made aware of it.
Part 1 is that there’s going to be a vote at the Annual General Meeting (“AGM”) on whether IEM should hold something called a Tender Offer (discussed below). For the Tender Offer to happen, at least 50% of shareholders have to vote in favour of it and so if you are a shareholder you will be able to vote, through your stock broker.
So, what is a Tender Offer? A Tender Offer is really simple. If it goes ahead then IEM will simply sell some of its investments and use the money raised to buy back shares directly from shareholders who want to sell. Why would you not just sell your shares in the market through your broker if you wanted to sell them?
Back in post “2.3 Funds: ETFs & Investment Trusts” we discussed in the section called “Premium / Discount to Net Asset Value (“NAV”)” that the share price of an Investment Trust can be different to the NAV per share. For IEM, the NAV at the time of writing is around £4.48 per share but the share price is only £4.31 which is a discount of just under 4%. So, right now, if you could choose to sell your shares immediately you would rather receive £4.48 from the company rather than receive £4.31 by selling them in the market.
Part 2 of the corporate action is that shareholders can choose to participate in the Tender Offer if it goes ahead and sell some or all of their shares. They do this by letting their stock broker know and the deadline is in around a weeks’ time.
If the Tender Offer goes ahead, once the deadline passes IEM will know how many shareholders have chosen to sell their shares. They can then sell the correct amount of investments needed to raise the cash to buy the shares from participating shareholders. Afterwards IEM will be a smaller fund as it will have sold some of its investments to buy back shares.
At the moment shareholders don’t know how much cash will be received as the NAV will move around between now and when the company sells its investments so they might receive more or less than the £4.48 NAV above. Remember, the Tender Offer will only happen if 50% of shareholders vote for it.
Normally this would be all we would need to think about but unfortunately there is a complication. There is a large investor called Saba who is calling for changes to be made at IEM and they own 22% of the shares. If the Tender Offer goes ahead and Saba does not participate, it will own a potentially much larger percentage of IEM than the 22% it owns now. That means it may be able to take control of what remains of IEM after the Tender Offer. Of course, we have no idea whether this will be a good or bad thing for the fund.
If you are a shareholder, we cannot advise you what to do and you should gather as much information as you can to help you decide. You should have been contacted by your stock broker and full details can be found on IEM’s website which is: https://www.iemplc.co.uk/
Two important statements from the Directors can be found in the “Exit Tender Offer Circular (17th March 2026)” on IEM’s website and are:
“All of the Directors intend to vote in favour of the Resolution.“
“All of the Directors intend to tender their Shares under the Exit Tender Offer.”
An alternative to the Tender Offer that’s always open to shareholders is to simply sell their shares in the market through their stock broker. If this is done, shareholders will get around 4% less than NAV as discussed above but what they will get is certainty.
If you find this a confusing situation then we understand. This is a highly unusual situation due to the activist investor but do your research and in the context of investing for decades, do not over-worry.
A FAVOUR
If you find our posts helpful in building a bright financial future then in exchange, please sign up to receive them by email. The more people that subscribe the more we grow which means we can create more content to help you become unimaginably wealthy. You can sign up using the subscribe box at the top of our website: https://thecrazyplan.com
*** Please spread the word!
This blog is free as we want everyone to have access to financial education. We hope to inspire you to set out on your own journey to a bright financial future and if we do, in return please spread the word to others.
NEXT MONTH
Next month we’re going to take a look at our portfolio again and see if we can improve it by changing any of our investments. We first looked at this in post “3.1 Portfolio Rebalance & Review” and said we’ll do it every 3 months going forwards. This is going to become one of our long-term habits that will help us on our journey to unimaginable wealth.
DISCLAIMER
Please note that by the time this blog is published, we may no longer own some or any of the investments discussed. Strategies and investments discussed might be totally unsuitable for you and we are not recommending them to you, they should only be considered as ideas for further research. You must read and agree to our Terms & Conditions, including the Disclaimer, which can be found on the T&C page of our website: https://thecrazyplan.com
© TradeFloor Promotions Limited 2026
