January 2026
WELCOME
Welcome to The Crazy Plan where our mission is to show that anyone can create unimaginable wealth.
Each month, we publish a blog providing readers with the financial education needed to set out on their own journey to a bright financial future. We do this by following two plans, our Monthly Plan saves £50 a month for 10 years and our Lumpsum Plan starts with a one-off £10,000. Our aim is to turn each plan into $1 billion in one or two generations.
At first, making $1 billion seems crazy but once you realise it’s a journey then things change. We’ll save our first £50 and from there our wealth will build to $1,000, then $5,000, then $10,000 and then $50,000. One day, if we’re patient, we’ll have $100,000 and then we’ll be looking at $1 million. From there it will be onwards to our $1 billion goal. This journey of small steps is how what seems impossible becomes possible.
You can dig-in to our posts however you like or if you are completely new to investing, you may want to start with “1.0 Liftoff!” and go through them in order which is how we build the education. We hope to provide you with the knowledge needed to set out on your own journey to a bright financial future if you choose. You can also visit the “About” page on our website to learn more about our plan.
All readers must read and agree to our Terms & Conditions, including the Disclaimer, which can be found on the T&C page of our website: https://thecrazyplan.com
ON WITH THE PLAN
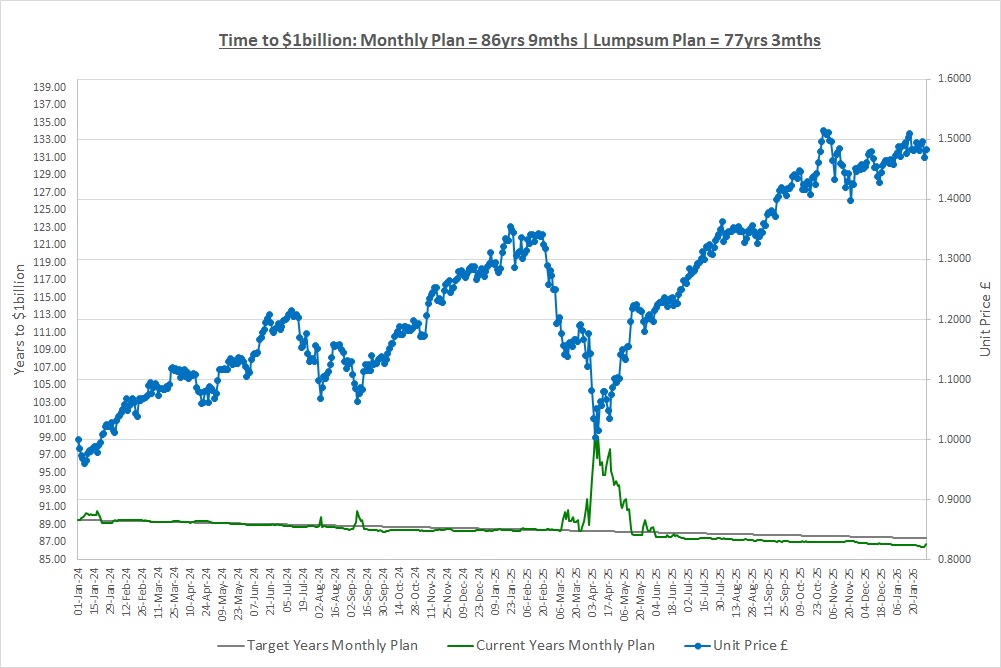
Our Lumpsum Plan will be worth $1billion in: 77yrs 3mths
Our Monthly Plan will be worth $1billion in: 86yrs 9ths
Please subscribe for free to receive our posts by email using the Subscribe box at the top of our website.
Last month we reviewed the year so we won’t repeat that here by doing a review of it! Instead, we’ll look at one of the often-overlooked reasons we’ll be successful in building wealth. Anyone reading our first post “1.0 Liftoff!” back in 2024 would have thought we were crazy to even think we could set out to make $1 billion but here we are, two years into our journey. The thread that runs through the last two years is repeating good money habits over and over again. It sounds too simple but that really is all we have done and the habits are:
- Daily: resisting the temptation to spend
- Weekly: educating ourselves on investing
- Weekly: researching to find new funds
- Regularly: reviewing our Plan and updating it
- Monthly: saving £50 on The Monthly Plan
- 3 Monthly: reviewing our Portfolio to improve it (a new habit this year)
- 6 Monthly: investing our cash savings on the Monthly Plan
- Annually: rebalancing our portfolio
All these habits are extremely easy things to do once you have done them a few times. The challenge is repeating them consistently over decades. We only changed one investment in our portfolio in the last two years but we performed these habits month in, month out and we will not succeed without them.
This month we’re going to focus on three of these habits: investing small amounts of money; rebalancing our portfolio; and then we’ll review our portfolio for the first time.
INVESTING SMALL AMOUNTS
On 02/Jan the Monthly Plan invested all the cash it had saved up over the previous 6 months and bought units in The Crazy Fund as you’ll see in the investment report later on. If you’re on your own Monthly Plan then this will not be possible as the amount you have to invest is too small as we have discussed before.
However, we looked at how to invest small amounts back in post “1.8 Investing Small Amounts & Correlation.” Options included buying one investment every six months and building your portfolio that way to buying the ones you can afford. We also looked at correlation and how we can use it to find alternative investments that perform in a very similar way.
If you’re looking to invest your monthly savings we recommend you re-read that post. Remember, there is no perfect solution and whatever portfolio you build you have every chance of doing better than The Crazy Fund. It’s only with hindsight that we’ll know what the perfect portfolio would have been.
REBALANCING A PORTFOLIO
The last time we rebalanced our portfolio was in January last year and we covered this in detail in post “2.1 Rebalancing a Portfolio.” We rebalance to minimize the risk of losing a lot of money on a single investment should something adverse happen to that investment. We decided to rebalance annually and the key steps were:
Step 1: Get the live share prices and then value each investment and the portfolio overall
The overall portfolio value is the value of all of our investments using live share prices plus any cash we have.
Step 2: Estimate the trades needed to rebalance the portfolio
We want 10% of our portfolio value in each investment as we have 10 investments. We work out how much of each investment we need to buy or sell to get to 10% and then divide by the live share price to get the number of shares we need to buy or sell.
Step 3: Work out the order to execute the trades in
Remember, we don’t want the last trade we do to be buying £100 of shares if the share price is £101 as we won’t be able to buy any shares. So, when buying shares, we start with the largest share price first.
Step 4: Execute the trades to rebalance the portfolio
We sell the investments we need to reduce and that generates cash. We then use that cash to buy the investments we need to increase in the order we just worked out in Step 3.
We recommend reviewing the rebalancing post again. A few years down the line this will be second nature but at the moment, the important thing is to not hurry and just work through the process slowly.
REVIEWING OUR INVESTMENTS – CAN WE DO BETTER?
In post “2.11 Our Plan: Pulling It All Together” we said one of the most important things to do from now on is “look to improve.” This month we’re going to do that by taking a look at our portfolio and we’ll do it every 3 months from now on. As we’re investing for decades we need to make sure our portfolio doesn’t become stale: firstly, we don’t want to get stuck in investments that massively underperform; and secondly, we don’t want to miss new investments that could improve our performance.
By the end of this section, we hope to leave you with more questions than answers. Over the coming months we’ll work through our approach to picking investments and building a portfolio which will hopefully give you the answers. So, let’s get stuck straight in by looking at some information for four portfolios:
| Result | Live.PF | Overall | CAGR | AvgDD |
| CAGR | 19.6% | 19.7% | 20.3% | 17.8% |
| DD.Avg | 23.5% | 21.3% | 22.4% | 19.4% |
| DD1 | 30.1% | 29.5% | 28.1% | 26.2% |
| DD2 | 28.0% | 23.7% | 26.6% | 22.9% |
| DD3 | 25.6% | 23.1% | 25.2% | 21.9% |
| DD4 | 20.1% | 19.3% | 19.7% | 17.0% |
| DD5 | 13.9% | 10.8% | 12.4% | 9.1% |
| DDT.Avg | 206 | 171 | 197 | 194 |
| DDT1 | 554 | 412 | 521 | 489 |
| DDT2 | 159 | 159 | 160 | 159 |
| DDT3 | 130 | 119 | 127 | 159 |
| DDT4 | 98 | 84 | 95 | 82 |
| DDT5 | 91 | 82 | 84 | 82 |
Note: DD = Drawdown, DDT = Drawdown Time in trading days (weekdays excluding holidays)
The table shows four different portfolios, each containing 10 investments. For each portfolio we’ve time-travelled back 10 years and pretended we started investing in January 2016 by putting 1/10th of our money into each investment. We then looked at what “would” have happened over the last 10 years if we’d kept these investments and just rebalanced them annually each January back to equal weights.
The above calculations are for the share price moves of the investments only, they do not include dividends as we don’t have total return indexes available which include dividends. In an ideal world we would use total returns but as we don’t have them we’ll do the best we can, we don’t have to be perfect.
The four portfolios are our live one called “Live.PF” and then three new ones called: “Overall” that has a good balance of CAGR and Drawdown; “CAGR” that has a better CAGR; and “AvgDD” that has better drawdowns.
Our Live Portfolio
If we had started our live portfolio 10 years ago and had never changed an investment but just rebalanced, we would have made a CAGR of 19.6%. Wow! This is an incredible return and significantly higher than our 15% target and the 10% that the S&P500 has historically returned so, what’s the catch?
Well, the bad news is that the five worst drawdowns would have averaged (23.5%) with the worst one being (30.1%) and the smallest being (13.9%). The five longest drawdowns (note: these might not be the biggest ones) would have lasted an average of 206 trading days which if you include weekends is roughly 289 days. The longest was a whopping 554 trading days or roughly 776 days so over 2 years, ouch.
Now we know how our portfolio “would” have performed if we had started 10 years ago, let’s ask ourselves a few questions.
Question 1: Would you swap for one of the new portfolios?
The “Overall” portfolio made almost exactly the same return, 19.7% v our 19.6%, but suffered smaller and shorter drawdowns. After 10 years we would have ended up with almost exactly the same amount of money so apart from a slight improvement in drawdowns, there isn’t a massive reason to swap. Or is there? Do we think the new “Overall” portfolio will continue to have smaller drawdowns in which case should we swap?
How about the “CAGR” portfolio? With hindsight, sitting here how, of course we would swap as it returned a CAGR of 20.3% which is 0.7% pa greater than our portfolio. It also had slightly better drawdowns than our portfolio as well so yes, swapping looks like a good idea although those drawdowns are still rather large.
What about the “AvgDD” portfolio? Would you swap? No way! Look at the lousy return, it only made a CAGR of 17.8% when we made 19.6% and the best portfolio made 20.3%. There is one very appealing quality about this portfolio though, we would have slept better at night. The longest drawdown was 65 trading days shorter than our live portfolio, or 91 days including weekends and that means a lot more sleep so perhaps we should think about it?
Question 2: What about the returns?
All of the portfolios made very solid CAGRs but we don’t know how consistent the returns were. If we look at the “CAGR” portfolio we might find it made huge profits in 2 out of the 10 years and then lost money in the other 8. Would we want to be invested in something that’s so inconsistent? If we swapped to that portfolio we might have to wait years to make any money and there is no guarantee that we ever would.
Question 3: What are the total return impacts?
How would the above analysis look if we included dividends? Well, dividends are income that’s not included in the above analysis so if we use Total Return indexes the CAGR of all portfolios would be higher and the drawdowns would be lower and that’s good. Our analysis is conservative and we like that.
It does mean that the comparisons are not accurate but remember, the difference in dividends between the portfolios is most likely (we hate using those words) to be around 1 to 3% pa. Whilst it could change our decision, at the end of the day all four portfolios made solid returns even excluding dividends.
Question 4: What is in each portfolio?
Surely we would like to know what the 10 investments in each portfolio are? We know what the “Live.PF” is as we own it but what about the new portfolios? Back in post “2.10 What Do Funds Invest In” we talked about sectors and how they can help us diversify by not having all our investments in one sector. Without knowing what investments are in each portfolio we could be running huge concentration risk if we swapped to a new portfolio.
Question 5: What about costs?
The above analysis doesn’t include the costs of rebalancing annually and so will that have an impact? Well, not really as the analysis rebalances each portfolio once a year and so each portfolio will incur roughly the same costs. Costs will, however, reduce the CAGR of each portfolio but in terms of looking at them relative to each other the impact will be minimal.
Question 6: Can we even look at history?
One of the biggest questions of all is whether it’s even correct to look historically at how each portfolio has performed? Surely we should look to the future and work out if we think the investment approach the fund has and the companies it owns are set up to do well over the coming years? The past is just history so what can we gain from looking at it, surely we should look forwards?
Question 8: What do the four portfolios’ returns actually look like?
We can answer that with a simple chart so here’s the 10-year chart:
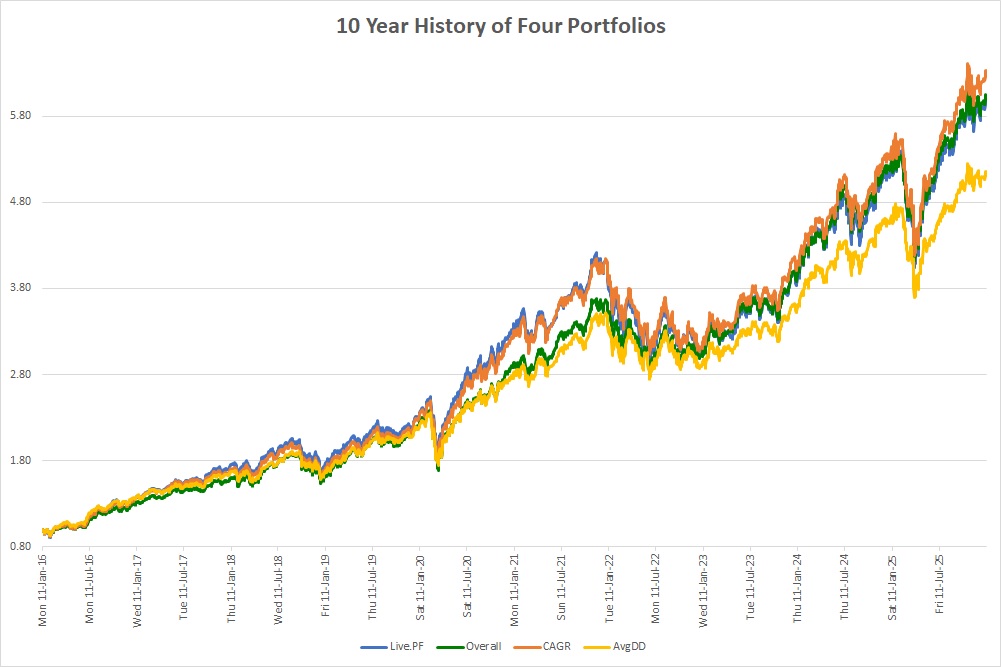
Does this help us decide? What we can see is that there’s a huge correlation between the portfolios with the odd one out being the “AvgDD” portfolio where the lower return is clearly visible (for a refresher on correlation see post “1.8 Investing Small Amounts & Correlation.”) Over the entire 10 years every £1 invested would have compounded as follows:
| Portfolio | Live.PF | Overall | CAGR | AvgDD |
| 10 Year Value | 6.00 | 6.03 | 6.33 | 5.16 |
Looking at the chart and the value of each £1 invested let’s forget the “AvgDD” portfolio, why would we invest in that? With the other three portfolios there isn’t much difference between them so should we swap to the “CAGR” portfolio? What about the costs of moving to this portfolio since it only made an extra £0.33 over the 10 years for each £1 invested compared to our live portfolio? Then of course there’s the problem that our live portfolio might have just had a bad period recently (which the graph seems to suggest) and if it turns around and comes back to beat the “CAGR” portfolio we’ll feel stupid!
So, what did we do? Well, we decided to do nothing after this review and left our portfolio unchanged and we’ll do another review in 3 months’ time. Why? Well we need to get some answers to the above questions!
SUMMING IT ALL UP
This month we’ve further embedded the two habits of investing small amounts and rebalancing our portfolio. We’re going to do these for decades and the more we do them the easier they’ll become. They are an extremely important part of our plan and are two of the keys to success.
We’ve also introduced the new habit of reviewing our portfolio which has resulted in a lot of questions. There’s one thing that’s extremely important to see through all these questions though and that’s the following; we would have been extremely happy to have been invested in any of the above four portfolios for the last 10 years as the worst case was a 17.8% CAGR.
All the questions we raise are trying to put icing on the cake but the important thing is that we have a cake, all four portfolios have done extremely well. Going forwards we’ll take a look at how to get the cake which is the core portfolio. We’ll also see how we can try and have the icing too which means choosing between the four portfolios.
In reality, the icing is dependent on the individual investor as some people might want to target a 10% CAGR with the smallest drawdown possible, whilst others might be prepared to accept larger drawdowns in order to potentially earn higher returns.
The lesson to take away this month is that we don’t have to be perfect, we just need to be consistent. Don’t forget that all of the above portfolios own real businesses that sell real products to millions of people all around the world every day. Over the long-term, these businesses make profits and those profits belong to us as shareholders.
THE INVESTMENT REPORT
For an explanation of The Investment Report and The Crazy Fund please see our post “1.1 The Deep End”
| Fri 30-Jan-26 | Monthly Plan | Lumpsum Plan |
| Cash last month £ | 300 | 0 |
| Cash Saved £ | 55 | 0 |
| Unit buys / sells £ | (300) | 0 |
| Total Cash £ | 55 | 0 |
| Units last month | 725 | 10,000 |
| Units bought / sold | 205 | 0 |
| Total Units owned | 930 | 10,000 |
| Unit Price £ | 1.4832 | 1.4832 |
| Fund Value £ | 1,379 | 14,832 |
| Total Wealth £ | 1,435 | 14,832 |
| FX Rate | 1.3687 | 1.3687 |
| Total Wealth $ | 1,964 | 20,301 |
| Estimated CAGR | 15.00% | 15.00% |
| Years to $1billion | 86yrs 9mths | 77yrs 3mths |
On 02/Jan the Monthly Plan invested its cash of £300 and bought units in The Crazy Fund at a unit price of 1.4654. We saved another £50 during the month and also received just over £5 of interest from our bank which was earned on our cash savings over the last year. As usual, the Lumpsum Plan was patient and resisted the temptation to spend and the importance of this is not to be underestimated.
THE CRAZY FUND
| Results | 31-Dec-25 | 30-Jan-26 | MTD Move | YTD Move | LTD Move |
| Unit Price £ | 1.4649 | 1.4832 | 1.25% | 1.25% | 48.32% |
| FX Rate | 1.3471 | 1.3687 | 1.61% | 1.61% | 7.58% |
| Unit Price $ | 1.9734 | 2.0301 | 2.88% | 2.88% | 59.56% |
| CAGR £ | 21.02% | 20.83% | (0.19%) | (0.19%) | 20.83% |
It was another positive month for our investments and we said last month how these small results compound over time. Again, the FX rate to see what we’re worth in USD moved in our favour and so overall it was a very solid month.
For sharp-eyed readers, you’ll see we made a profit this month but our CAGR went down. This is due to the impact of time on our CAGR. If we make zero profit in a month then slowly our CAGR will drift lower as our CAGR is measured since we started just over 2 years ago and we are “spreading” the same profit over a longer period of time.
Below is a table of what the fund is invested in at 30/January:
| Ticker | % Fund | Price | CCY | Type | Description |
| LON:IEM | 10.5% | 410.00 | GBP | IT | Impax Environmental Markets PLC |
| LON:SMT | 10.4% | 1,255.50 | GBP | IT | Scottish Mortgage Investment Trust PLC |
| LON:XDEM | 9.7% | 6,182.00 | GBP | ETF | DB X-Trackers MSCI World Momentum Factor UCITS |
| LON:ATT | 9.7% | 546.00 | GBP | IT | Allianz Technology Trust PLC |
| LON:IITU | 9.6% | 3,016.00 | GBP | ETF | iShares S&P 500 Information Technology |
| LON:PCT | 10.6% | 497.00 | GBP | IT | Polar Capital Technology Trust PLC |
| LON:XDWT | 9.8% | 116.49 | USD | ETF | Xtrackers MSCI World Information Technology UCITS |
| LON:CSP1 | 9.9% | 54,199.00 | GBP | ETF | iShares Core S&P 500 UCITS (Acc) GBP Hedged |
| LON:EQQQ | 9.7% | 45,792.00 | GBP | ETF | Invesco NASDAQ 100 UCITS GBP Hedged |
| LON:JAM | 9.9% | 1,108.00 | GBP | IT | JP Morgan American Investment Trust PLC |
| Shares | 100.0% | ||||
| Cash | 0.0% |
On 14/Jan we rebalanced our portfolio back to equal weights as we discussed above. After we’d done this our smallest holding represented 9.6% of our portfolio and our largest 10.4%, we don’t have to get to exactly 10% weights just close enough. Since this rebalance the share prices have of course moved leaving us with the weights in the above table at month end.
A FAVOUR
If you find our posts helpful in building a bright financial future then in exchange, please sign up to receive them by email. The more people that subscribe the more we grow which means we can create more content to help you become unimaginably wealthy. You can sign up using the subscribe box at the top of our website: https://thecrazyplan.com
*** Please spread the word!
This blog is free as we want everyone to have access to financial education. We hope to inspire you to set out on your own journey to a bright financial future and if we do, in return please spread the word to others.
NEXT MONTH
Next month we’re going to look at the foundations of a portfolio by starting to think about how to choose a fund to put on our watch list of potential investments. We’ll spend a couple of posts on this and then move on to how to build a portfolio from our watchlist of funds.
DISCLAIMER
Please note that by the time this blog is published, we may no longer own some or any of the investments discussed. Strategies and investments discussed might be totally unsuitable for you and we are not recommending them to you, they should only be considered as ideas for further research. You must read and agree to our Terms & Conditions, including the Disclaimer, which can be found on the T&C page of our website: https://thecrazyplan.com
© TradeFloor Promotions Limited 2026
