August 2025
WELCOME
Welcome to The Crazy Plan where our mission is to show that anyone can create unimaginable wealth.
Each month, we publish a blog providing readers with the financial education needed to set out on their own journey to a bright financial future. We do this by following two plans, our Monthly Plan saves £50 a month for 10 years and our Lumpsum Plan starts with a one-off £10,000. Our aim is to turn each plan into $1 billion in one or two generations.
At first, making $1 billion seems crazy but once you realise it’s a journey then things change. We’ll save our first £50 and from there our wealth will build to $1,000, then $5,000, then $10,000 and then $50,000. One day, if we’re patient, we’ll have $100,000 and then we’ll be looking at $1 million. From there it will be onwards to our $1 billion goal. This journey of small steps is how what seems impossible becomes possible.
You can dig-in to our posts however you like or if you are completely new to investing, you may want to start with “1.0 Liftoff!” and go through them in order which is how we build the education. We hope to provide you with the knowledge needed to set out on your own journey to a bright financial future if you choose. You can also visit the “About” page on our website to learn more about our plan.
All readers must read and agree to our Terms & Conditions, including the Disclaimer, which can be found on the T&C page of our website: https://thecrazyplan.com
ON WITH THE PLAN
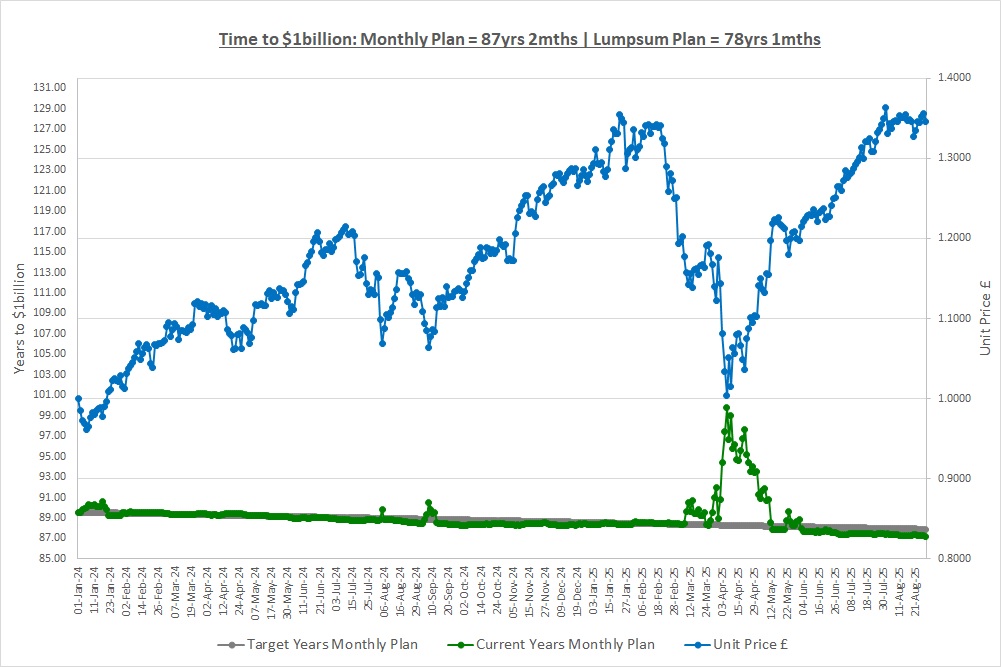
Our Lumpsum Plan will be worth $1billion in: 78yrs 1mth
Our Monthly Plan will be worth $1billion in: 87yrs 2mths
Last month we started by looking at log scales which are like plotting data as if the moves are percentages. This allows us to see if returns are consistent and whether they are getting better or worse. We then looked at the returns of the S&P500 over the last 150 years on a log scale and what we saw was quite remarkable. With one or two exceptions, the S&P500 has marched higher decade in, decade out with a relentless 10% CAGR being the result. Last month’s post is so important that it’s worth another read.
This month we’re going to look at one side of the volatility of those returns. As we said back in post “2.4 Risk & Volatility”, volatility tells us nothing about the direction of travel and whether the investment has gone up or down in value, it just tells us that the journey was noisy. We said that markets can be volatile and go up which is good, or they can be volatile and go down which is bad. So, a better way to look at volatility is to look at the painful side which is the downside and we can do this by looking at something called “Drawdown.”
DRAWDOWN DEFINITION
Drawdown is simply how much money you’ve lost as a percentage of the maximum amount you were ever worth, which we’ll call “Peak Wealth.” Let’s look at an example by using the first month of The Crazy Fund back in January 2024. The next chart is from post “1.1 The Deep End” and is The Crazy Fund over our first month:
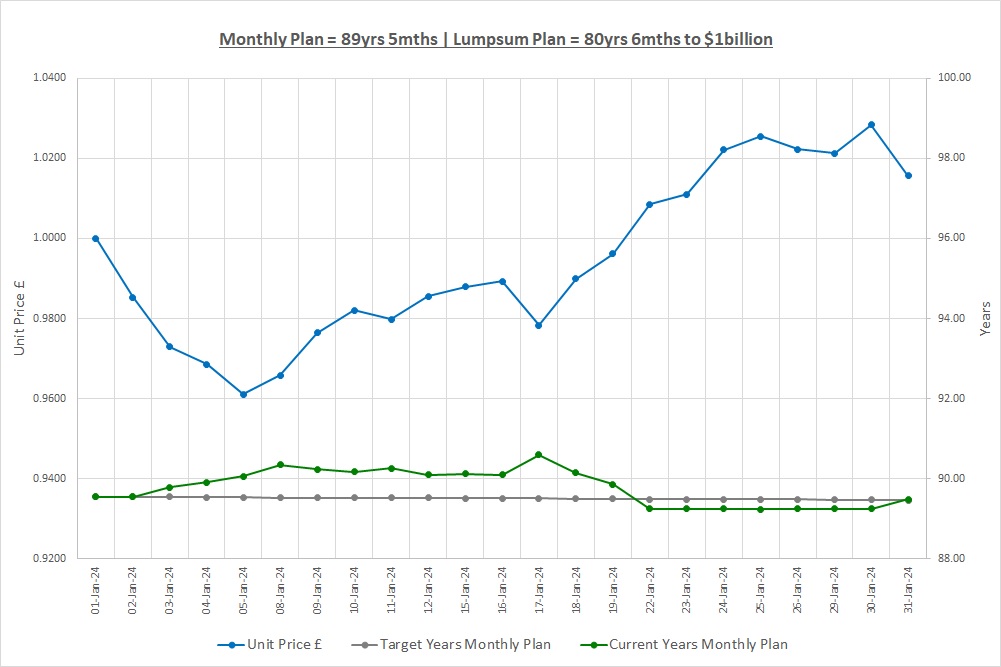
Drawdown #1: 14 days long with a maximum drawdown of (3.9%) on 05/Jan
Let’s say we bought 1 unit of The Crazy Fund for £1.0000 on 01/Jan. Our Peak Wealth was therefore £1.0000 since this is the most we’d ever been worth. Unfortunately, on 02/Jan the unit price started going down and we immediately went into what is called drawdown. On 05/Jan our investment hit a low of £0.9611 which was a drawdown of (3.9%) from our Peak Wealth of £1.0000. From this low point the unit price marched higher over the coming days until all the losses had been recovered on 22/Jan meaning the drawdown lasted 14 days.
Drawdown #2: 2 days long with a maximum drawdown of (0.4%) on 29/Jan
From 22/Jan the unit price kept going up, hitting a new Peak Wealth every day until 25/Jan when our wealth hit £1.0255. A second drawdown then started with the unit price hitting a low of £1.0212 on 29/Jan which was a loss of (0.4%) from our new Peak Wealth of £1.0255. These losses were then made back and a new Peak Wealth of £1.0283 was hit on 30/Jan.
Drawdown #3: Currently 1 day long with a drawdown so far of (1.2%) on 31/Jan
On 31/Jan the unit price came off to £1.0156 which is a drawdown of (1.2%) from our Peak Wealth of £1.0283. We are currently in a drawdown and we have no idea how long or how large this drawdown will be.
Data Frequency
In the above example we looked at the price of The Crazy Fund on a daily basis but we could choose any period we like and it will give very different results. We could choose to look at minute, hourly, daily, weekly, monthly, quarterly or annual prices, it really is up to us, but daily is the most common when looking at stock markets.
Let’s look at the price monthly instead of daily. We buy 1 unit again on 01/Jan for £1.0000 which means our Peak Wealth is £1.0000. As we are now only looking at monthly prices, we ignore all the daily prices and just look at the unit price at the end of the month on 31/Jan which was £1.0156. This gives a new Peak Wealth of £1.0156 so we are not in drawdown as our previous Peak Wealth was £1.0000 on 01/Jan. The next time we look at the price will be 29/Feb as we are using monthly prices.
So, if you look at prices less often the drawdowns are smaller as you don’t see the lower prices on all the days you choose to ignore. It doesn’t mean these drawdowns didn’t happen, you just ignore them.
That’s all drawdown is, how much you’ve lost as a percentage from the maximum you were ever worth. So, every time you hit a new peak in wealth you measure any drawdown from this new, higher level. It’s also important to know how long it took to recover from the drawdown as well as we’ll talk about in a minute.
S&P500 DRAWDOWNS
Last month we saw there was huge volatility in the CAGRs of the S&P500 over the last 150 years. We saw that the largest 1-year return was 134.7% and smallest was a thumping loss of (62.3%) and even over a 50-year investment period, returns varied from +13.8% to + 4.9%. So, what sort of drawdowns did the S&P500 see over those 150 years? We’ve used the same prices of the S&P500 as last month which are the prices at month end and again, thanks to McQuarrie and Schiller for the incredible research they have done to generate this data. So, what do the drawdowns look like?
| Biggest Drawdowns | Longest Drawdowns | ||||||
| DD.N | DD.Peak | DD.Date | DD.Time | DD.N | DD.Time | DD.Date | DD.Peak |
| 1 | (81.8%) | 1932.6 | 15y3m | 1 | 15y3m | 1932.6 | (81.8%) |
| 2 | (49.0%) | 2009.3 | 4y9m | 2 | 6y1m | 2003.2 | (41.6%) |
| 3 | (41.6%) | 2003.2 | 6y1m | 3 | 4y9m | 2009.3 | (49.0%) |
| 4 | (39.2%) | 1974.12 | 3y5m | 4 | 4y6m | 1893.8 | (25.1%) |
| 5 | (33.9%) | 1907.11 | 2y2m | 5 | 3y5m | 1974.12 | (39.2%) |
| 6 | (27.9%) | 1917.12 | 2y5m | 6 | 3y4m | 1947.5 | (19.8%) |
| 7 | (26.0%) | 1987.12 | 1y8m | 7 | 3y1m | 1885.1 | (21.5%) |
| 8 | (25.7%) | 1903.10 | 2y1m | 8 | 2y10m | 1914.12 | (15.7%) |
| 9 | (25.3%) | 1970.6 | 2y2m | 9 | 2y5m | 1917.12 | (27.9%) |
| 10 | (25.1%) | 1893.8 | 4y6m | 10 | 2y5m | 1917.12 | (27.9%) |
| 11 | (23.0%) | 1921.8 | 2y5m | 11 | 2y2m | 1907.11 | (33.9%) |
| 12 | (21.5%) | 1885.1 | 3y1m | 12 | 2y2m | 1907.11 | (33.9%) |
| 13 | (21.2%) | 1962.6 | 1y3m | 13 | 2y1m | 1903.10 | (25.7%) |
| 14 | (19.8%) | 1947.5 | 3y4m | 14 | 2y0m | 1888.6 | (10.8%) |
| 15 | (19.3%) | 2022.10 | 1y11m | 15 | 1y11m | 2022.10 | (19.3%) |
| 16 | (18.9%) | 2020.3 | 5m | 16 | 1y8m | 1987.12 | (26.0%) |
| 17 | (16.1%) | 1890.12 | 1y3m | 17 | 1y5m | 1910.7 | (13.8%) |
| 18 | (15.7%) | 1914.12 | 2y10m | 18 | 1y5m | 1910.7 | (13.8%) |
| 19 | (15.7%) | 1957.11 | 1y0m | 19 | 1y5m | 1910.7 | (13.8%) |
| 20 | (15.3%) | 1966.10 | 1y2m | 20 | 1y3m | 1962.6 | (21.2%) |
| 21 | (13.9%) | 1990.10 | 6m | 21 | 1y3m | 1962.6 | (21.2%) |
| 22 | (13.8%) | 1910.7 | 1y5m | 22 | 1y3m | 1962.6 | (21.2%) |
| 23 | (13.4%) | 1982.3 | 1y5m | 23 | 1y2m | 1966.10 | (15.3%) |
| 24 | (12.8%) | 1923.7 | 1y3m | 24 | 1y2m | 1966.10 | (15.3%) |
| 25 | (11.5%) | 1998.9 | 4m | 25 | 1y0m | 1957.11 | (15.7%) |
| 26 | (11.1%) | 2018.12 | 6m | 26 | 1y0m | 1957.11 | (15.7%) |
| 27 | (10.9%) | 2025.4 | 3m | 27 | 11m | 1900.6 | (7.3%) |
| 28 | (10.8%) | 1888.6 | 2y0m | 28 | 10m | 1957.2 | (8.9%) |
| 29 | (10.4%) | 1978.2 | 1y5m | 29 | 10m | 1957.2 | (8.9%) |
| 30 | (9.8%) | 1980.4 | 3m | 30 | 9m | 1911.9 | (9.2%) |
At first glance, these drawdowns look extremely ugly. However, it is important to remember that 150 years is an incredibly long time and the S&P500 has returned a 10% CAGR despite these drawdowns.
Over the 150 years there were 166 drawdowns in total so first of all, drawdowns are extremely common. The table shows the 30 largest drawdowns and the 30 longest and please spend some time just looking at the table and soaking up the information. This post is about realising that our journey to $1 billion is not going to be smooth, it will have some extremely rough periods and so just get familiar with the information in the table as it is a guide as to what to expect on our journey.
30 Largest Drawdowns
The largest drawdown of (81.8%) was the great crash of 1929 which you can research if you are interested. Some people choose to ignore this drawdown, believing it was an exception and that market regulation has now changed so a similar panic will not happen again. We believe it should be included as there is no such thing as “this time is different.” Clearly the loss would have been devastating to live through, especially given how long it took to recover which was just over 15 years. None the less, recover it did and the market marched to new highs in the following decades.
The next largest loss of (49.0%) is the financial crisis of 2007/8 which resulted in a drawdown lasting just under 5 years. Whilst extremely painful, 5 years is not so long to have to wait for a recovery from such a large loss. The same is true of the third largest drawdown of (41.6%) which is the bursting of the Dot Com bubble in the early 2000’s. This lasted just over 6 years but again, the market recovered and here we are today at new highs.
So, looking at the table, drawdowns of 10% to 15% are extremely common and we need to get used to them as they will be frequent our journey to $1 billion. Drawdowns greater than 25% are not so common but do occur, usually recovering in 3 years or so but they will be painful to live through and will test us. We might well see a loss of 50% or more and if we do we must remember that history is on our side as the market has always recovered if we are patient.
30 Longest Drawdowns
Clearly we would rather not have large drawdowns but if we do, it would be better if the recovery happened as quickly as possible. Fortunately, most drawdowns have been recovered from quickly and out of the 166 drawdowns in total, there were only 24 which were longer than 1 year, 7 longer than 3 years and only 2 longer than 5 years.
Given we are investing for decades this is extremely encouraging since losses have historically been recovered quickly. The reason we want a quick recovery is that all the time we are in drawdown, inflation is most likely doing its thing and making us poorer from year to year. A short drawdown means we are back to making money and beating inflation quickly which is what we want.
CONCLUSION
This month’s post is about showing what to expect on our journey to $1 billion. If we are down 5%, 10% or even 15% we must not panic as we can see from the table that this is to be expected and is quite normal. It’s going to be a very bumpy ride and we are highly likely to face an extremely painful drawdown at some point, like the 2008/9 financial crisis or the Dot Com bubble bursting.
We must remember that drawdowns are extremely common and are the price to pay to earn a return that beats inflation. Despite all these drawdowns, the S&P has earned a 10% CAGR over the last 150 years and if we can achieve that, we will become wealthy beyond our dreams. The key will be to not panic, be patient and remain committed to our plan.
The above drawdown table raises a question which is “are there things we can do to reduce these drawdowns?” We discussed using stop losses for single stocks back in post “1.1 Disasters & Solutions” and so are stops something we can use to help? We will work on this in the future but if achieving the same 10% CAGR with a significantly reduced drawdown was easy, then everyone would be doing it and there would be far more billionaires (if they resisted the temptation to spend!).
THE INVESTMENT REPORT
For an explanation of The Investment Report and The Crazy Fund please see our post “1.1 The Deep End”
| Fri 29-Aug-25 | Monthly Plan | Lumpsum Plan |
| Cash last month £ | 50 | 0 |
| Cash Saved £ | 50 | 0 |
| Unit buys / sells £ | 0 | 0 |
| Total Cash £ | 100 | 0 |
| Units last month | 725 | 10,000 |
| Units bought / sold | 0 | 0 |
| Total Units owned | 725 | 10,000 |
| Unit Price £ | 1.3458 | 1.3458 |
| Fund Value £ | 976 | 13,458 |
| Total Wealth £ | 1,076 | 13,458 |
| FX Rate | 1.3508 | 1.3508 |
| Total Wealth $ | 1,454 | 18,179 |
| Estimated CAGR | 15.00% | 15.00% |
| Years to $1billion | 87yrs 2mths | 78yrs 1mths |
The power of habit is under-appreciated. The habits of: saving £50 on the Monthly Plan; and resisting the temptation to spend on both plans are really bedding in now and both plans are on track to reach $1 billion.
THE CRAZY FUND
| Results | 31-Jul-25 | 29-Aug-25 | MTD Move | YTD Move | LTD Move |
| Unit Price £ | 1.3639 | 1.3458 | (1.33%) | 5.18% | 34.58% |
| FX Rate | 1.3234 | 1.3508 | 2.08% | 7.95% | 6.17% |
| Unit Price $ | 1.8050 | 1.8179 | 0.72% | 13.53% | 42.89% |
| CAGR £ | 21.67% | 19.57% | (2.10%) | (8.33%) | 19.57% |
A flat month this month with a small loss on our investments being made back on the FX rate to see what we’re worth in USD moving in our favour. Our CAGR is still comfortably above our target 15% but we expect this to reduce.
Below is a table of what the fund is invested in at 29/August:
| Ticker | % Fund | Price | CCY | Type | Description |
| LON:IEM | 9.7% | 397.00 | GBP | IT | Impax Environmental Markets PLC |
| LON:SMT | 10.2% | 1,098.00 | GBP | IT | Scottish Mortgage Investment Trust PLC |
| LON:XDEM | 10.0% | 5,713.00 | GBP | ETF | DB X-Trackers MSCI World Momentum Factor UCITS |
| LON:ATT | 10.3% | 460.50 | GBP | IT | Allianz Technology Trust PLC |
| LON:IITU | 10.3% | 2,836.00 | GBP | ETF | iShares S&P 500 Information Technology |
| LON:PCT | 10.7% | 398.00 | GBP | IT | Polar Capital Technology Trust PLC |
| LON:XDWT | 10.0% | 107.81 | USD | ETF | Xtrackers MSCI World Information Technology UCITS |
| LON:CSP1 | 9.7% | 51,022.00 | GBP | ETF | iShares Core S&P 500 UCITS (Acc) GBP Hedged |
| LON:EQQQ | 9.7% | 42,389.00 | GBP | ETF | Invesco NASDAQ 100 UCITS GBP Hedged |
| LON:JAM | 9.1% | 1,072.00 | GBP | IT | JP Morgan American Investment Trust PLC |
| Shares | 99.7% | ||||
| Cash | 0.3% |
Our cash balance ticked up a little this month due to two dividends being declared:
- On 14/Aug IEM went x-Div and paid on 28/Aug
- On 28/Aug JAM went x-Dev and this is due to be paid on 06/Oct
For a refresher on dividends please see post “1.7 Some Things Companies Do.” Otherwise, there were no changes to our investments this month.
A FAVOUR
*** Please Subscribe!
If you find our posts helpful in building a bright financial future then in exchange, please sign up to receive them by email. The more people that subscribe the more we grow which means we can create more content to help you become unimaginably wealthy. You can sign up using the subscribe box at the top of our website: https://thecrazyplan.com
*** Please Spread The Word! This blog is free as we want everyone to have access to financial education. We hope to inspire you to set out on your own journey to a bright financial future and if we do, in return please spread the word to others.
NEXT MONTH
Next month we’re going to talk about debt and keeping up with the Joneses. We’ve not talked about debt yet but it really is the elephant in the room for a lot of people and so we’ll discuss what no one wants to talk about.
DISCLAIMER
Please note that by the time this blog is published, we may no longer own some or any of the investments discussed. Strategies and investments discussed might be totally unsuitable for you and we are not recommending them to you, they should only be considered as ideas for further research. You must read and agree to our Terms & Conditions, including the Disclaimer, which can be found on the T&C page of our website: https://thecrazyplan.com
© TradeFloor Promotions Limited 2025
