June 2025
WELCOME
Welcome to The Crazy Plan where our mission is to show that anyone can create unimaginable wealth.
Each month, we publish a blog providing readers with the financial education needed to set out on their own journey to a bright financial future. We do this by following two plans, our Monthly Plan saves £50 a month for 10 years and our Lumpsum Plan starts with a one-off £10,000. Our aim is to turn each plan into $1 billion in one or two generations.
At first, making $1 billion seems crazy but once you realise it’s a journey then things change. We’ll save our first £50 and from there our wealth will build to $1,000, then $5,000, then $10,000 and then $50,000. One day, if we’re patient, we’ll have $100,000 and then we’ll be looking at $1 million. From there it will be onwards to our $1 billion goal. This journey of small steps is how what seems impossible becomes possible.
You can dig-in to our posts however you like or if you are completely new to investing, you may want to start with “1.0 Liftoff!” and go through them in order which is how we build the education. We hope to provide you with the knowledge needed to set out on your own journey to a bright financial future if you choose. You can also visit the “About” page on our website to learn more about our plan.
All readers must read and agree to our Terms & Conditions, including the Disclaimer, which can be found on the T&C page of our website: https://thecrazyplan.com
ON WITH THE PLAN
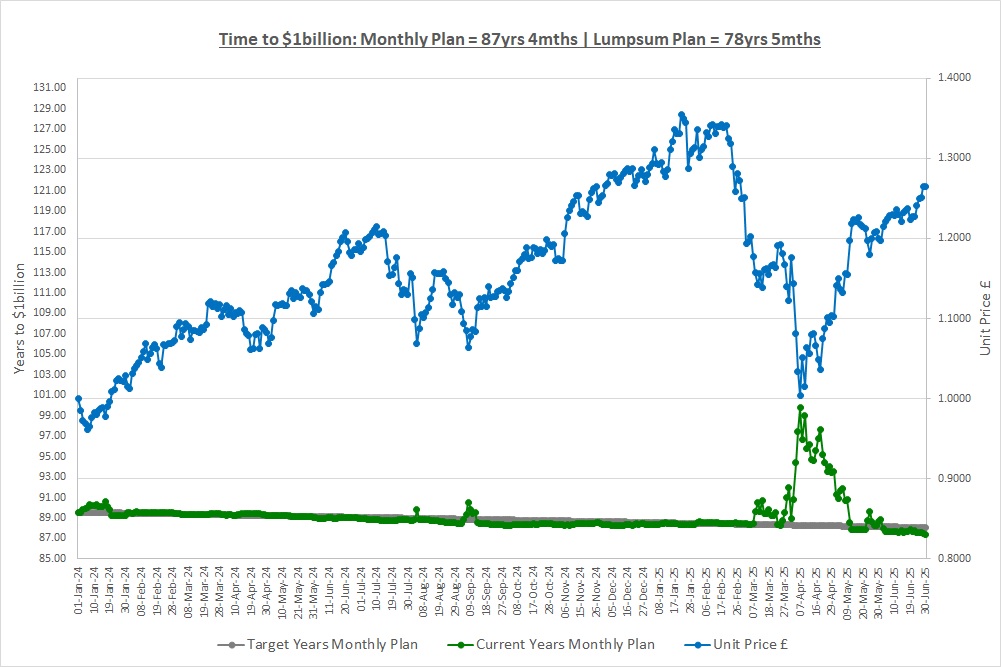
Our Lumpsum Plan will be worth $1billion in: 78yrs 5mths
Our Monthly Plan will be worth $1billion in: 87yrs 4mths
Last month we looked at the basics of stock market indexes and saw they are just one number to describe what’s happening to the share prices of lots of companies. An index has some definitions to describe how it’s calculated such as: the sample (how many companies and how to select them); the weighting (by market value etc); and the rebalancing period (3mths etc). We saw that Total Return Indexes include dividends and represent the actual return a shareholder would get if they owned all the companies in the index.
The great thing about indexes is that there are ETFs that track them which give us a cheap and easy way to get the return of an index without having to buy all the companies ourselves. This is a really important point, if we buy an ETF that tracks an index, it’s as if we’ve actually bought all the stocks in the index ourselves and that’s what our return will be from the ETF. This month we’re going to have a look at some examples of indexes and discuss an issue that may or may not be a problem.
THE UNIVERSE OF INDEXES
There are hundreds of indexes from providers like S&P Dow Jones, MSCI, FTSE Russell and Bloomberg. If you can think of a way of slicing a stock market then there’s probably an index that does it. We want to keep things simple so we’ll look at just 3 categories. Firstly, we’ll have a look at a global index, next we’ll take a look at a country index and finally we’ll look at a sector index.
There are so many indexes it can feel overwhelming and a word of warning, if you start researching indexes you might get swamped in technical definitions. Don’t! The important thing is to get the big picture. You’ll also see the words “free float” when you do some research so we’ll cover that quickly now.
FREE FLOAT
The total market value of a company is the share price multiplied by the number of shares issued. Sometimes though, some of the shares are not really available to buy as they might be “locked-in” by a few shareholders or for other reasons. If we look at Berkshire Hathaway for example, the company run by Warren Buffett (who’s now worth $150billion), he owns around 14% of the company. He’s always said he will never sell his shares, and never has, so they are said to be locked-in and are not available. The free float is simply the value of the company excluding these shares.
So, if Berkshire Hathaway has a total market value of $1trillion (yes, that’s one trillion) and Mr Buffett owns 14% of the company, the free float is 86% of the shares which is a free float market value of $860billion. That’s simply all free float means.
GLOBAL INDEXES
Global indexes give us a view on what’s happening in general around the world. Index providers put each country into a bucket describing how advanced it is in terms of industrialization, technology, infrastructure, living standards, politics and all manner of other criteria. The more advanced countries form a Developed Market Index, the ones in the middle form an Emerging Market Index and the last ones form a Frontier Market Index although some countries might not even make it into this last category.
There are dozens of global indexes so we’ll have a quick look at one of the best known which is the MSCI World Index. This is a developed market index priced in USD, it is free float market-value weighted and is rebalanced quarterly (go back to last months’ post if you need a refresher on this). It covers around 85% of the market value of all companies listed on developed country stock markets around the world and represents $75 trillion worth of companies.
There are 23 countries in the index and the largest weights are: US 71.8%; Japan 5.4%; UK 3.6%; Canada 3.2%; and France 2.7%. These 5 counties are 87% of the index with the remaining 18 being 13%.
There are 1,325 companies in the index with the largest being Nvidia 5.1%, Microsoft 4.7%, Apple 4.1%, Amazon 2.8%, Meta 2.2%, Broadcom 1.6%, Alphabet A 1.4%, Tesla 1.2%, Alphabet C 1.2%, JP Morgan 1.1%. These 10 companies are 25% of the index with the remaining 1,315 being 75%.
There are many ETF’s that track this index and some of them are also priced in currencies other than USD (currency again and yes, we keep putting this off!) We expect you can see some potential problems from the information above as there’s rather a lot of the US and a few companies are a large part of the index. We’ll talk about this shortly.
COUNTRY INDEXES
Next are country indexes that aim to give investors an understanding of what’s happening to the stock market of a specific country. We’ll take a look at the most well-known index which is the S&P500 we keep talking about. This index is priced in USD, is free float market-value weighted and is also rebalanced quarterly. It covers around 80% of the market value of all the companies listed on US Stock Markets and includes the largest 500 by market value representing $50 trillion worth of companies.
The largest companies in the index are Microsoft 6.8%, Nvidia 6.6%, Apple 6.0%, Amazon 3.9%, Meta 2.8%, Broadcom 2.3%, Alphabet A 2.0%, Tesla 1.9%, Berkshire Hathaway 1.8%, Alphabet C 1.6%. These 10 companies are 35% of the index with the remaining 490 being 65%.
If some of these names look familiar to those in the MSCI World Index then that’s because they are the same companies. It looks like we might have the same problems with the index being very exposed to a few companies.
The Crazy fund owns an S&P500 ETF tracker at the moment, LON:CSP1, that tracks the index but it’s priced in GBP not USD. This means we essentially own all the companies in the index. This is great, we just buy one investment and it’s as if we own 500 companies. Our investment has 6.8% of it in Microsoft, 6.6% in Nvidia etc and we’ll make money as the companies in the index do well or lose money as they do poorly.
SECTOR INDEXES
A sector index is made up of companies that operate in the same industry. The first thing the index providers do is assign every company on the stock market to a sector such as Information Technology, Financials, Consumer Goods, Industrials, Energy, Real Estate etc. They then take the companies in a sector and calculate an index from them. There are dozens of sectors so we’ll have a quick look at one, the MSCI World Information Technology Index. This index is priced in USD and includes only developed markets. It is free float market-value weighted and is also rebalanced quarterly. The index represents companies with a total market value of $20 trillion.
There are 141 companies in the index with the largest being Nvidia 19.6%, Microsoft 17.8%, Apple 15.7%, Broadcom 6.3%, Oracle 1.9%, SAP 1.6%, ASML 1.6%, Palantir 1.5%, CISCO 1.4%, IBM 1.4%. These 10 companies are 69% of the index with the remaining 131 being 31%. Yet again, a lot of these names are the same as those in the MSCI World Index and the S&P500 Index.
The main countries represented in the index are the US 90.5%, Japan 2.8%, Germany 1.9%, Netherlands 1.8%, Canada 1.3% making a total of 98% which is rather a lot! Note that China does not appear as it’s not classified as a developed market, it’s in the emerging market classification and so appears in those indexes.
The Crazy fund owns an MSCI World Information Technology Sector ETF tracker at the moment, LON:XDWT, that tracks the index so if the companies in the index do well we’ll make money and if they do poorly we’ll lose money.
So, these three examples of indexes and the ETFs that track them give a good idea of how easy it is to buy one investment and have exposure to lots of companies. Now let’s now look at those potential problems we’ve seen.
POTENTIAL PROBLEMS OF INDEXES
Back in post “2.1 Rebalancing a Portfolio” we saw that we can end up not being diversified as the winning companies in our portfolio get bigger and the losing ones get smaller. To address this, we can periodically rebalance our portfolio back to equal weights and we did this in January. The problem is, a lot of the major indexes are market-value weighted for a number of reasons we’ll not go into right now. This means we don’t have a choice, if we buy an ETF tracker on an index that’s market value weighted then that’s what we get, market value weighting.
So “world” does not seem to be the world as the US makes up 72% of the MSCI World Index with the other 22 countries only being 28% of the index. This should not really be a surprise though as the US is the largest economy in the world and back in post “1.6 Stock Markets” we saw that global stock markets were worth $100 trillion with the US being 50% of them. Likewise, the S&P”500” does not seem to be 500 stocks as the top 10 companies are 35% of the index with the remaining 490 only being 65%. Then look at the MSCI World Information Technology index, is it really “world” if 98% of the companies are US?!
If we put 1/3rd of our money into 3 ETFs tracking each of the indexes, we might think: “great, we own some stocks focusing on technology around the world, some US stocks and some world stocks.” When we dig a little deeper though it suddenly looks as if we’re not as diversified as we thought.
So, is this a problem? Well, the honest answer is yes and no. There will be periods where the concentration is bad for us if the larger companies in the index do poorly but there will also be periods where the concentration is good as they do well. Over the long-term these good and bad periods should average out and in fact they have. If we look at the S&P500 it’s made that relentless 10% CAGR for the last 50+ years despite concentration. In fact, over very long periods, concentration can be a good thing if it results in an index backing winners and we’ll have a look at this in another post.
One other point to remember is that just because a company is listed on the US stock market doesn’t mean it only sells to the US. As companies grow they often start to expand in other countries around the world and that’s when they become huge companies. Microsoft for example has about 50% of its revenue from the US and the rest is global. Apple sells its products and services in the US, Europe, China, Asia Pacific, all over the world. So, if we own stocks listed in the US that sell goods and services all around the world, we’re really investing globally. This means we’re a lot more diversified than the headline “US” tag suggests.
CONCLUSION
It’s easy to get lost in all the details of the countries, sectors, companies, weights etc in an index and how it’s calculated but all we need is the big picture. ETFs that track indexes allow us to make a single investment and get a return that’s as if we’d bought all the companies in the index in the weights specified. If we buy the S&P500 and Microsoft does well? We’ll make money. This is incredible as it’s easy and cheap to buy ETFs that track indexes and so this allows us to diversify easily (within the limitations we’ve just discussed).
Market-value weighting will sometimes cause problems when an index has more money in companies that do poorly but it will also benefit us when they do well. When looking at an index ETF tracker it’s therefore important to look at how it’s performed over a long period of time so that this concentration can even itself out.
THE END!
Unbelievably, we’ve now covered all the core information about companies, stock markets, funds and indexes. There are a few things we forgot to mention (!) and we’ll clean those up in a post later on but otherwise that’s all the core material done! If you’re unsure on anything then use your 2 hours a week of research to go back over the posts where you are a little rusty or unsure. Remember, it’s only you that can change your financial future, no one else, so go back and fill in any gaps.
We could sit back now and watch the next decades pass as we get richer and richer but we’re not going to do that. We’re going to continue learning and will now start looking at how to choose what investments to buy. What to buy and how much money to put into each investment is an extremely important point. We say it’s an ”extremely” important point and you might be wondering why it’s not “the” most important point? The reason is back in post “1.2 Sacrifice, Temptation & Commitment” as resisting the temptation to spend will probably be the most important reason for our success in reaching $1billion.
THE INVESTMENT REPORT
For an explanation of The Investment Report and The Crazy Fund please see our post “1.1 The Deep End”
| Mon 30-Jun-25 | Monthly Plan | Lumpsum Plan |
| Cash last month £ | 257 | 0 |
| Cash Saved £ | 50 | 0 |
| Unit buys / sells £ | 0 | 0 |
| Total Cash £ | 307 | 0 |
| Units last month | 483 | 10,000 |
| Units bought / sold | 0 | 0 |
| Total Units owned | 483 | 10,000 |
| Unit Price £ | 1.2649 | 1.2649 |
| Fund Value £ | 611 | 12,649 |
| Total Wealth £ | 918 | 12,649 |
| FX Rate | 1.3726 | 1.3726 |
| Total Wealth $ | 1,260 | 17,362 |
| Estimated CAGR | 15.00% | 15.00% |
| Years to $1billion | 87yrs 4mths | 78yrs 5mths |
We really can’t emphasise enough how incredible the Monthly Plan is and it’s now worth £918. 18 months ago, we could have said “what’s the point of saving £50, it’s hardly life changing.“ Instead, here we are, showing that we really can change our financial future for the better. We have just over £300 of cash saved on the Monthly Plan (savings of £50pm + interest on our cash + a small amount left when we last bought units) and so we’ll buy more units in The Crazy Fund next month.
Let’s also not forget the Lumpsum Plan which is doing really well and if you’re on that plan, you’ve already been through the saving phase to get your starting capital. Both plans are on track to reach $1billion.
THE CRAZY FUND
| Results | 30-May-25 | 30-Jun-25 | MTD Move | YTD Move | LTD Move |
| Unit Price £ | 1.2002 | 1.2649 | 5.40% | (1.15%) | 26.49% |
| FX Rate | 1.3480 | 1.3726 | 1.83% | 9.69% | 7.89% |
| Unit Price $ | 1.6179 | 1.7362 | 7.32% | 8.43% | 36.47% |
| CAGR £ | 13.79% | 16.99% | 3.20% | (10.91%) | 16.99% |
Another good month for The Crazy Fund with our investments making money and the FX rate to see how much we’re worth in USD moving in our favour. Our CAGR since we started is now back up to 17% but we’ll continue to cap the rate at 15%. We’re ahead of schedule at the moment as the green line shows.
Below is a table of what the fund is invested in at 30/June:
| Ticker | % Fund | Price | CCY | Type | Description |
| LON:IEM | 9.7% | 373.00 | GBP | IT | Impax Environmental Markets PLC |
| LON:SMT | 10.2% | 1,034.00 | GBP | IT | Scottish Mortgage Investment Trust PLC |
| LON:XDEM | 10.4% | 5,569.00 | GBP | ETF | DB X-Trackers MSCI World Momentum Factor UCITS |
| LON:ATT | 10.1% | 424.00 | GBP | IT | Allianz Technology Trust PLC |
| LON:IITU | 10.2% | 2,647.00 | GBP | ETF | iShares S&P 500 Information Technology |
| LON:PCT | 10.4% | 363.50 | GBP | IT | Polar Capital Technology Trust PLC |
| LON:XDWT | 10.0% | 102.65 | USD | ETF | Xtrackers MSCI World Information Technology UCITS |
| LON:CSP1 | 9.7% | 48,148.00 | GBP | ETF | iShares Core S&P 500 UCITS (Acc) GBP Hedged |
| LON:EQQQ | 9.8% | 40,346.00 | GBP | ETF | Invesco NASDAQ 100 UCITS GBP Hedged |
| LON:JAM | 9.2% | 1,022.00 | GBP | IT | JP Morgan American Investment Trust PLC |
| Shares | 99.8% | ||||
| Cash | 0.2% |
Our cash balance increased a small amount this month, so small it can’t be seen! EQQQ and SMT both went ex-dividend in the month. EQQQ paid in the month and the settlement date for SMT is in July. For a refresher on dividends see post “1.7 Some Things Companies Do.” There were no other changes in the month.
A FAVOUR
*** Please Subscribe!
If you find our posts helpful in building a bright financial future then in exchange, please sign up to receive them by email. The more people that subscribe the more we grow which means we can create more content to help you become unimaginably wealthy. You can sign up using the subscribe box at the top of our website: https://thecrazyplan.com
*** Please Spread The Word!
This blog is free as we want everyone to have access to financial education. We hope to inspire you to set out on your own journey to a bright financial future and if we do, in return please spread the word to others.
NEXT MONTH
Next month we’re going to finally look at currency! No, don’t worry, we’re joking! We’re actually going to look at the CAGR we might be able to achieve in the long-term. We keep talking about this 10% CAGR but where have we plucked that number from? Next month we’ll find out.
DISCLAIMER
Please note that by the time this blog is published, we may no longer own some or any of the investments discussed. Strategies and investments discussed might be totally unsuitable for you and we are not recommending them to you, they should only be considered as ideas for further research. You must read and agree to our Terms & Conditions, including the Disclaimer, which can be found on the T&C page of our website: https://thecrazyplan.com
© TradeFloor Promotions Limited 2025
