May 2025
WELCOME
Welcome to The Crazy Plan where our mission is to show that anyone can create unimaginable wealth.
Each month, we publish a blog providing readers with the financial education needed to set out on their own journey to a bright financial future. We do this by following two plans, our Monthly Plan saves £50 a month for 10 years and our Lumpsum Plan starts with a one-off £10,000. Our aim is to turn each plan into $1 billion in one or two generations.
At first, making $1 billion seems crazy but once you realise it’s a journey then things change. We’ll save our first £50 and from there our wealth will build to $1,000, then $5,000, then $10,000 and then $50,000. One day, if we’re patient, we’ll have $100,000 and then we’ll be looking at $1 million. From there it will be onwards to our $1 billion goal. This journey of small steps is how what seems impossible becomes possible.
You can dig-in to our posts however you like or if you are completely new to investing, you may want to start with “1.0 Liftoff!” and go through them in order which is how we build the education. We hope to provide you with the knowledge needed to set out on your own journey to a bright financial future if you choose. You can also visit the “About” page on our website to learn more about our plan.
All readers must read and agree to our Terms & Conditions, including the Disclaimer, which can be found on the T&C page of our website: https://thecrazyplan.com
ON WITH THE PLAN
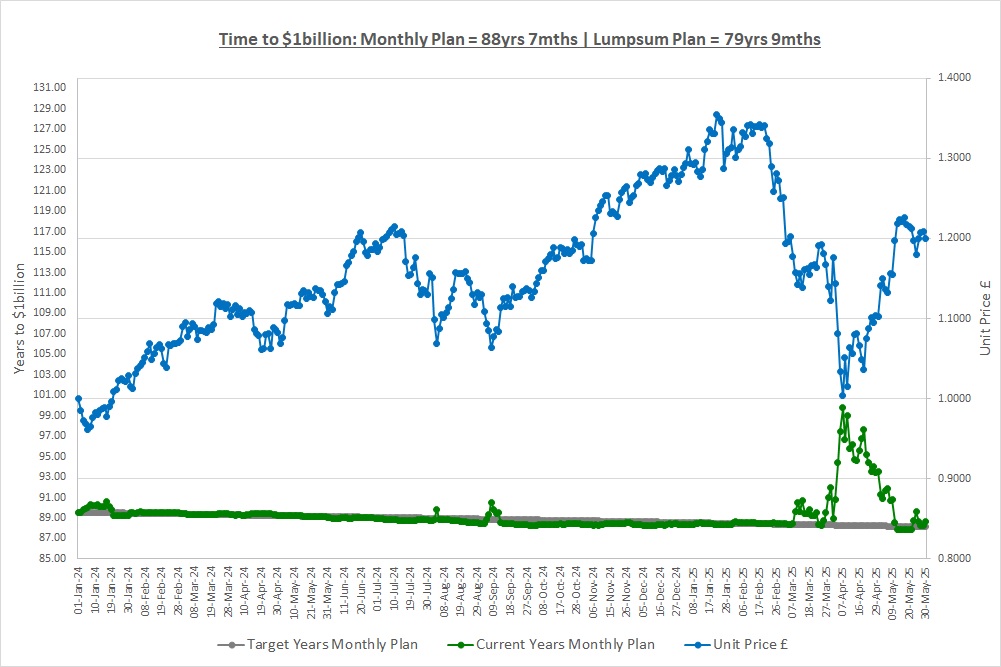
Our Monthly Plan will be worth $1billion in: 88yrs 7mths
Our Lumpsum Plan will be worth $1billion in: 79yrs 9mths
Last month we talked about Risk & Volatility and we saw that volatility is just noise. Volatility tells you whether the journey was bumpy or smooth but absolutely nothing about the direction of travel. We defined risk as being whether we’ll be able to afford to buy all the things we want in the future and if we won’t, then we’re taking a lot of risk. We looked at the drivers of risk and said we need to get the foundations in place which are: saving enough; resisting the temptation to spend; and avoiding a permanent loss of money. We then went on to see that in the short-term the main driver of risk is volatility but in the long-term it’s inflation. We concluded that when investing in the stock market, volatility has historically been the price to pay to earn the returns needed to overcome the damaging effects of inflation.
This month we’re going to take a look at stock market indexes in more detail as part of our plan is to use index investing. We’ve talked about indexes in almost every post when we’ve mentioned the S&P500 and in post “2.1 Rebalancing a Portfolio” we also mentioned the DAX40 index.
A FICTIONAL STOCK MARKET
The best way to understand indexes is to look at one and to do that we’ll make up a stock market of our own and create our own index. Our stock market has 3 companies listed on it and the details of them and what happened over the year are as follows:
| Company | SP Start | SP End | SP Move | MV Start £bn | MV End £bn |
| Winner Co | 500.00 | 1,125.00 | 125% | 2.00 | 4.50 |
| Boring Co | 250.00 | 250.00 | 0% | 1.50 | 1.50 |
| Loser Co | 1,000.00 | 100.00 | (90%) | 8.00 | 0.80 |
So, Winner Co starts the year with a share price of 500p and a market value of £2billion, over the year its share price goes up by 125% to 1,125p with the market value increasing to £4.5billion. Boring Co does nothing and Loser Co is a shocker, losing (90%) over the year!
WHAT IS AN INDEX?
A stock market index is just one number to represent lots of companies. It means you can look at that one number and have a good idea about how the overall value of those companies is changing without having to look at each company’s share price in detail. In our market it’s pretty easy to see what’s going on as we only have 3 companies but on a real stock market there are thousands of companies and it would be a nightmare to get an idea of what’s happening without an index.
An index needs some definitions so that you know what it represents and how it’s calculated but otherwise there’s not a lot more to know, it’s just one number to represent lots of stocks. So, let’s create our own index.
EQUAL WEIGHTED INDEX
Let’s specify our index as follows:
| Starting value: | 100 |
| Sample: | The 2 companies with the largest market value listed on the stock market |
| Weighting: | Equal Weighting |
| Rebalance: | Annually |
Starting value
This means that on the very first day we start our index it will have a value of 100. We could have chosen any value, it really doesn’t matter as going forwards we’re only concerned with how the index changes, not what the actual value is.
Sample
From all the stocks listed on the stock market, our index is only going to include the two that have the largest market value at the beginning of the year. That means our index will only use Winner Co (MV £2bn) and Loser Co (MV £8bn), Boring Co (MV £1.5bn) will not be part of our index.
Weighting
This tells us how much of the index each company will represent. Equal weighting means that each company will be 50% of our index as we have 2 companies in it. If we had three companies then each company would be 33.33% of our index etc.
Rebalancing
This is how often we’ll update and choose the companies in our index, which is annually. This means that at the end of the year we’ll look at all the stocks on our stock market again and once more pick the 2 companies with the largest market values.
So, let’s put our index together:
- We can think of the starting value as how much money we have to invest which is £100
- We Invest it in Winner Co and Loser Co putting £50 into each of them (50% each as our index is equal weights)
Let’s see what happens over the year:
| Company | Invest £ | SP Move | Value YE £ |
| Winner Co | 50.00 | 125.00% | 112.50 |
| Loser Co | 50.00 | (90.00%) | 5.00 |
| Index | 100.00 | 17.50% | 117.50 |
Our index starts at 100.00 and ends the year at 117.50 which is the average change in the share prices of the companies in our index as we put 50% of our money into each stock. That’s all the index is, it really is that simple.
So, an equally weighted index tells us how much, on average, the share prices of the stocks in the index have moved over the year.
For the second year our index will now start at 117.50 and we’ll invest 50% in Winner Co and 50% in Boring Co as these are now the two largest companies by market value. Loser Co gets relegated from the index as its market value (£0.8bn) is now less than Boring Co’s (£1.5bn), which gets promoted to the index. We would then see how the share prices move over the second year to calculate the index value at the end of year 2 and then just keep repeating this year to year.
MARKET-VALUE WEIGHTED INDEX
Let’s start year 1 again and specify a different index as follows:
| Starting value: | 100 |
| Sample: | The 2 companies with the largest market value listed on the stock market |
| Weighting: | Market-Value Weighting |
| Rebalance: | Annually |
This is almost the same as our first index except we now weight the companies in our index by their market values. The total market value of Winner Co and Loser Co is £10bn (£2bn + £8bn) and so we put 20% of our money (£2bn / £10bn) into Winner Co and 80% (£8bn / £10bn) into Loser Co and the results now look like this at the end of the first year:
| Company | Invest £ | SP Move | Value YE £ |
| Winner Co | 20.00 | 125.00% | 45.00 |
| Loser Co | 80.00 | (90.00%) | 8.00 |
| Index | 100.00 | (47.00%) | 53.00 |
As you can see, this leads to a hugely different result as we had most of our money in Loser Co which lost (90%) over the year! It works the other way too, if Loser Co has gone up over the year then we would have done extremely well since we had most of our money in it. Our index finishes the year at 53.00 compared to 117.50 for the equally weighted index.
So, a market-value weighted index tells us what has happened to the overall market value of all the stocks in the index over the year.
For the second year we start with an index value of 53.00. Loser Co gets relegated and replaced with Boring Co and so the total market value of the companies in our index is £6bn (£4.5bn + £1.5bn). We invest 75% in Winner Co (£4.5bn / £6bn) and 25% in Boring Co (£1.5bn / £6bn) and off we go again.
FACTOR WEIGHTINGS
In our examples we used the market value to select the stocks used to calculate the index. The market value is something called a “factor” which simply means a piece of information about a stock. For the market-value weighted index we also used this factor to decide how much of the index each stock would represent.
Historically, market value has typically been used as the factor for both selecting stocks and for calculating the weights, with equal weighting being less common.
You can now find indexes that use different factors other than market value for their construction. For example, you could select the 100 companies that have the largest sales and construct an index from that. You could use momentum as the Sample factor and then market value as the Weighting factor. This can get very complicated very quickly as there are hundreds of factors so always check what index you’re looking at and get a rough idea as to how it’s calculated.
TOTAL-RETURN INDEXES
The indexes we’ve looked at so far have only told us what happened to the share prices (and by definition the market value) of the companies in our index. In the real world, if we buy shares in a company and it pays a dividend then we’ll receive that dividend as well. When you do some research you’ll also see that there are Total-Return indexes. Total-return simply means that they represent what you would have received in total if you had invested in the stocks in the index and so they include dividends.
In our market-value weighted index that ended the year at 53.00, if Loser Co had paid a dividend in the year of £60 (causing most of the share price sell-off) then the end value of a total-return index would have been 113.00 (53.00 capital value + 60.00 dividends) as it would include that dividend. Loser Co would still be relegated from the index and replaced with Boring Co though as we’re selecting the stocks for our index based on market value not on their total return.
STOCK MARKET INDEX PROVIDERS
If all this sounds like a lot of work then don’t worry, it’s not. We don’t have to sit down each day and work out what the index values are, that would not be 2 hours work a week! There are companies out there that publish indexes on a live basis, second by second, as the share prices of the underlying companies move around and also the Index levels at the close of each day.
The four main index providers are S&P Dow Jones, MSCI, FTSE Russell and Bloomberg. They are all just big financial companies who have all the data and know-how to calculate these indexes. There are all sorts of rules over how they construct the indexes, for example how often they re-balance and decide which companies should be included. We’ve used annual re-balancing for our examples to make life simple but you could choose any period.
Because there’s more than one index provider you can have several indexes that are almost identical. For example, S&P Dow Jones, MSCI, FTSE Russell and Bloomberg might all publish an index based on the largest 500 companies on the US market and so we’ll end up with 4 Indexes that move in almost the same way. We say “almost” the same because they might have started on different dates and so the starting values will be different and they might use slightly different rules or re-balance their index on different days. In terms of the big picture though they’ll all show the relentless 10% CAGR over the long-run that stocks have returned.
SUMMARY
An index is simply one number to represent lots of stocks so it’s easier to get an idea about what’s happening generally in the market. It’s important to have a rough idea how the index is calculated so that we know what a change in the index means. An equal weighted index tells you how much on average the share prices of the companies in the index move and a market-value weighted index tells you how much the total market value of all the companies in the index moves.
As we’ll see in another post, the great thing about indexes is that they often have an ETF (Exchange Traded Fund) that tracks them and so they can offer a cheap way to invest more broadly in the stock market without having to buy 100’s of companies ourselves.
THE INVESTMENT REPORT
For an explanation of The Investment Report and The Crazy Fund please see our post “1.1 The Deep End”
| Fri 30-May-25 | Monthly Plan | Lumpsum Plan |
| Cash last month £ | 207 | 0 |
| Cash Saved £ | 50 | 0 |
| Unit buys / sells £ | 0 | 0 |
| Total Cash £ | 257 | 0 |
| Units last month | 483 | 10,000 |
| Units bought / sold | 0 | 0 |
| Total Units owned | 483 | 10,000 |
| Unit Price £ | 1.2002 | 1.2002 |
| Fund Value £ | 580 | 12,002 |
| Total Wealth £ | 837 | 12,002 |
| FX Rate | 1.3480 | 1.3480 |
| Total Wealth $ | 1,128 | 16,179 |
| Estimated CAGR | 14.83% | 14.83% |
| Years to $1billion | 88yrs 7mths | 79yrs 9mths |
Our saving is relentless on the Monthly Plan and we’re slowly building wealth month by month. The benefits of having a plan, discipline and commitment are starting to show.
THE CRAZY FUND
| Results | 30-Apr-25 | 30-May-25 | MTD Move | YTD Move | LTD Move |
| Unit Price £ | 1.1026 | 1.2002 | 8.86% | (6.21%) | 20.02% |
| FX Rate | 1.3371 | 1.3480 | 0.82% | 7.72% | 5.95% |
| Unit Price $ | 1.4743 | 1.6179 | 9.74% | 1.04% | 27.17% |
| CAGR £ | 7.62% | 13.79% | 6.17% | (14.11%) | 13.79% |
The Crazy Fund has recovered more of the losses we suffered and the FX rate went our way too giving a total return over the month of almost 10%. Markets are extremely volatile at the moment, bear in mind that our target is to make 10 to 15% a year and we have just made almost 10% in a month.
Below is a table of what the fund is invested in at 30/May:
| Ticker | % Fund | Price | CCY | Type | Description |
| LON:IEM | 10.1% | 368.00 | GBP | IT | Impax Environmental Markets PLC |
| LON:SMT | 10.3% | 984.60 | GBP | IT | Scottish Mortgage Investment Trust PLC |
| LON:XDEM | 10.7% | 5,460.00 | GBP | ETF | DB X-Trackers MSCI World Momentum Factor UCITS |
| LON:ATT | 9.8% | 390.00 | GBP | IT | Allianz Technology Trust PLC |
| LON:IITU | 10.0% | 2,462.75 | GBP | ETF | iShares S&P 500 Information Technology |
| LON:PCT | 9.8% | 326.50 | GBP | IT | Polar Capital Technology Trust PLC |
| LON:XDWT | 9.8% | 94.25 | USD | ETF | Xtrackers MSCI World Information Technology UCITS |
| LON:CSP1 | 9.9% | 46,592.00 | GBP | ETF | iShares Core S&P 500 UCITS (Acc) GBP Hedged |
| LON:EQQQ | 9.9% | 38,639.00 | GBP | ETF | Invesco NASDAQ 100 UCITS GBP Hedged |
| LON:JAM | 9.4% | 989.00 | GBP | IT | JP Morgan American Investment Trust PLC |
| Shares | 99.8% | ||||
| Cash | 0.2% |
None of our investments declared a dividend in the month and there were no changes to our portfolio.
A FAVOUR
*** Please Subscribe!
If you find our posts helpful in building a bright financial future then in exchange, please sign up to receive them by email. The more people that subscribe the more we grow which means we can create more content to help you become unimaginably wealthy. You can sign up using the subscribe box at the top of our website: https://thecrazyplan.com
*** Please Spread The Word!
This blog is free as we want everyone to have access to financial education. We hope to inspire you to set out on your own journey to a bright financial future and if we do, in return please spread the word to others.
NEXT MONTH
Next month we’ll continue to look at indexes and will have a look at a few common indexes that we’ll come across. We’ll also have a look at some potential problems with indexes that we should be aware of as well.
*** Please subscribe to our posts using the “Subscribe” box at the top of our website and don’t forget to spread the word!
DISCLAIMER
Please note that by the time this blog is published, we may no longer own some or any of the investments discussed. Strategies and investments discussed might be totally unsuitable for you and we are not recommending them to you, they should only be considered as ideas for further research. You must read and agree to our Terms & Conditions, including the Disclaimer, which can be found on the T&C page of our website: https://thecrazyplan.com
© TradeFloor Promotions Limited 2025
