March 2025
WELCOME
Welcome to The Crazy Plan where our mission is to show that anyone can create unimaginable wealth.
Each month, we publish a blog providing readers with the financial education needed to set out on their own journey to a bright financial future. We do this by following two plans, our Monthly Plan saves £50 a month for 10 years and our Lumpsum Plan starts with a one-off £10,000. Our aim is to turn each plan into $1 billion in one or two generations.
At first, making $1 billion seems crazy but once you realise it’s a journey then things change. We’ll save our first £50 and from there our wealth will build to $1,000, then $5,000, then $10,000 and then $50,000. One day, if we’re patient, we’ll have $100,000 and then we’ll be looking at $1 million. From there it will be onwards to our $1 billion goal. This journey of small steps is how what seems impossible becomes possible.
You can dig-in to our posts however you like or if you are completely new to investing, you may want to start with “1.0 Liftoff!” and go through them in order which is how we build the education. We hope to provide you with the knowledge needed to set out on your own journey to a bright financial future if you choose. You can also visit the “About” page on our website to learn more about our plan.
All readers must read and agree to our Terms & Conditions, including the Disclaimer, which can be found on the T&C page of our website: https://thecrazyplan.com
ON WITH THE PLAN
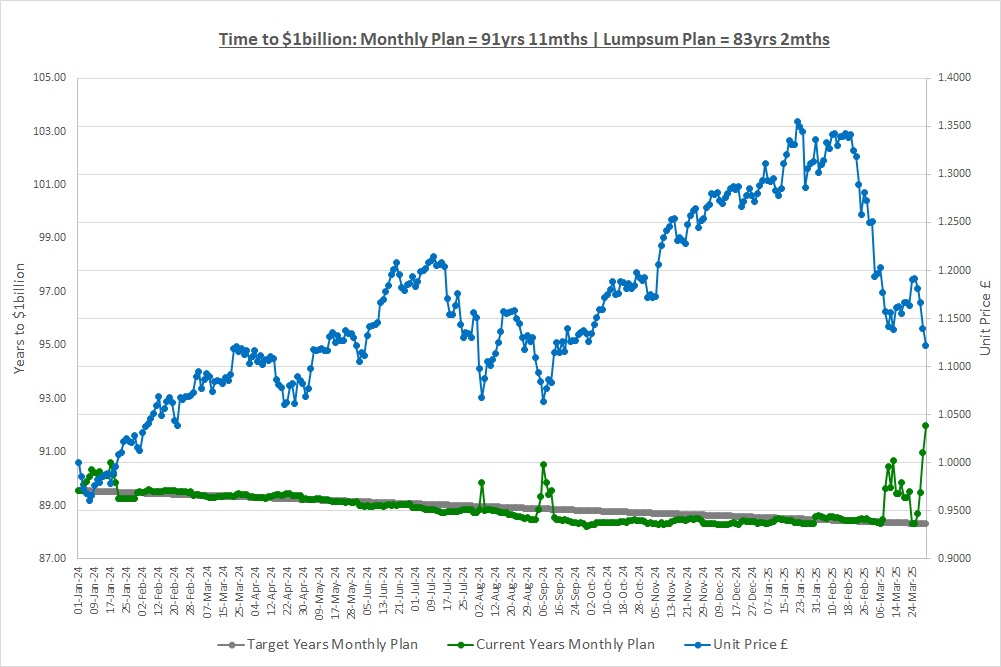
Our Lumpsum Plan will be worth $1billion in: 83yrs 2mths
Our Monthly Plan will be worth $1billion in: 91yrs 11mths
Last month we looked at a type of fund called a Unit Trust / Mutual Fund (“UT”). We saw that this type of fund is open-ended as investors can put money in or take it out on a daily basis and typically they are actively managed as the fund manager makes all the decisions on what to invest in. Investors can usually choose to buy accumulation or distribution units either directly from the Fund itself or through a third party such as a broker or financial advisor. This month we’re going to look at two other funds and they are Exchange Traded Funds and Investment Trusts.
EXCHANGE TRADES FUNDS (“ETF’s”)
An ETF is again, simply a pool of money from lots of investors and the investment manager goes off and invests the money on their behalf. There will be a Custodian to look after the assets and Trustees to make sure the ETF is run properly. ETFs are usually open-ended so the amount of money in the fund goes up and down from day to day. To put money into the fund, you buy shares in the ETF on a stock-exchange through a broker in the same way you buy shares in a company and usually there’s a choice of either accumulation or distribution shares. So, an ETF is very similar to a UT except investors buy shares on a stock-exchange not units from the fund manager.
Let’s say we want to invest in the S&P500 which as we know is an index of the largest 500 companies in the US. We could try and buy all 500 companies ourselves but this would be a complete nightmare and virtually impossible from a practical point of view so instead, we could buy an ETF that tracks the S&P500.
When you buy an ETF there are no up-front costs or annual holding fees and so the only costs incurred are the Total Expense Ratio (“TER”). These costs are extremely low for an ETF that tracks an index as once the ETF is set up, the computer does all the work. On an S&P500 ETF the TER can be as low as 0.03% – 0.15% a year, a fraction of the cost of running an actively managed fund which as we saw last month can be 1% to 2.5% a year.
Passive Management
An ETF is usually “passively managed” which means the fund manager does not make any investment decisions. There’s no choice what to invest in, the ETF has to track the index and so once the algorithm is set up to follow the index there’s very little to do and this is the reason costs are so low. Also, there won’t be any leverage used as the fund simply aims to return the same as the index, not beat it.
The ETF will issue an Investor Information Document where you can see what the aim of the fund is. There may also be information about two aspects of the fund we’ve not come across before and they are: Tracking Error; and Premium / Discount to NAV.
Tracking Error
If we buy an S&P500 ETF then we want it to give us the return of the S&P500. However, the actual return will be slightly different for a number of reasons and the difference is called the tracking error. Say the S&P500 makes 10.00% over a year, if the ETF makes 9.95% then the tracking error is 0.05%. One of the reasons for tracking error is costs, if an ETF has costs of 0.03% then we would expect the return of the ETF to be 0.03% lower than the index.
Other reasons for tracking error are due to how the ETF tracks the index. For example, if we buy £100 of the ETF the fund manager needs to buy 500 companies with our £100 but the amount of money is too small to do this. The ETF might wait for other investors to put money into the fund and when there’s enough new money they will invest it. While waiting, if the S&P500 goes up by 1% the ETF has lost out as the cash should have been invested and so the return of the ETF will be lower than the return of the S&P500 it’s trying to track. If the S&P500 goes down while it’s waiting then it will outperform the index as it will not lose money on the cash it’s holding while waiting.
Another example is that the ETF might not buy all 500 companies in the S&P500, it might only buy 450 and use correlation to decide which ones to own (see post “1.8 Investing Small Amounts & Correlation” for a correlation refresher). Not owning all 500 companies in the index will lead to a different return which could be better or worse than the index. In reality, the tracking error of ETFs provided by the main players in this field is tiny and we don’t need to worry but at least we’ll know why the return is not quite the same as the index.
Premium / Discount to Net Asset Value (“NAV”)
Last month we saw that the NAV of a fund is simply the total value of all the investments and cash in the fund net of all borrowings. For a UT, the unit price is simply the NAV divided by the number of units in issue and this is the price investors can buy units at.
The NAV per share of an ETF is calculated in exactly the same way, it’s the NAV divided by the number of shares in issue. The share price of an ETF however is set by investors buying and selling shares on the stock exchange so supply and demand for the IT’s shares sets the price. This means there can be a difference between the share price and the NAV. If the share price is higher than the NAV the ETF is trading at a “premium” to NAV and if it’s lower, the ETF is trading at a “discount.” For something like an S&P500 tracker, the difference will be tiny and we can ignore it but when we talk about Investment Trusts shortly we’ll have a look at this in more detail. That’s all we want to say on ETFs, we now know enough for our plan.
INVESTMENT TRUSTS (“ITs”)
Yes, we’re going to repeat ourselves as ITs are just a pool of money from lots of investors and the investment manager goes off and invests the money on their behalf! One main difference of ITs though is that they are companies, not trusts (confusing hey?) and we’ve talked about companies before. You buy shares in ITs on a stock exchange and sometimes you might again have the choice of accumulation or distribution shares. There are no up-front or holding costs as you’re just buying shares and the TER will normally be around 1% to 2.5% per year as most ITs are actively managed like UTs.
ITs usually have a custodian that looks after the assets of fund but they don’t have trustees, instead they have a board of directors as they are companies. The board does the same thing as the trustees, making sure the IT is run properly in the interests of shareholders. There will be an Investor Information Document detailing the investment strategy and they are actively managed as the investment manager makes all the investment decisions and can use leverage if the fund permits it. There are one or two more areas we’ll quickly look at as you’ll come across them in your research.
Closed-End
ITs are “closed-end” which means the amount of money in the fund does not change from day to day. When the IT was first launched, the initial investors bought shares in the IT and all the money raised went into the company and the investment manager is now responsible for investing it. If you buy shares in an IT, you buy them from an existing shareholder who wants to sell their shares, not from the company and you do this via a stock exchange. The money you pay for your shares is sent to the investor who sold their shares and so the amount of money in the IT does not change. This is called being a “closed-end” fund, the fund is closed to new money. The only way for an IT to increase the amount of money in the fund is to do a rights issue or new issue of shares to investors but this does not happen very often.
Premium / Discount to Net Asset Value (“NAV”)
The NAV per share of an IT is again the total value of all the investments and cash in the fund, net of all borrowings, divided by the total number of shares in issue. Let’s pretend that: the IT owns shares in 50 companies; the NAV is £100 per share; and the share price is £100. The share price of the IT is set by supply and demand as people buy and sell shares so as people buy shares, the share price will go up and as they sell them, the share price will go down. If a new investor decides to buy a lot of shares in the IT then if there are no sellers, the share price will go up and up until existing shareholders are tempted to sell their shares to the new investor. This continues until the new investor has bought all the shares they want and let’s say that the share price of the IT moves up to £101.
The investments the IT has, the 50 companies it owns, might not have not moved at all during this time so the NAV is still £100 per share even though the share price is now £101. The demand for shares has pushed the share price up and it’s now trading at a premium to NAV. If the opposite happens and the share price is below the NAV, then it trades at a discount to NAV.
So, the share price is driven by the buying and selling of the IT’s shares which might not be due to changes in the NAV; the NAV is driven by the value of the investments the IT owns; and as a result, the two can be different. The difference can be large, some ITs trade at discounts of 20% or more for long periods of time which means you can buy £100 of investments (the NAV) for £80! The trouble is premiums or discounts can persist for months or years and so you think you’re getting a bargain but you can’t realize the £20 of value quickly as the discount just remains with the share price stuck at £80.
Clearly, buying investments worth £100 for £80 is great and so ITs usually have a policy in place to manage the discount. If there’s a 20% discount to NAV the IT might do a share buy-back (see post “1.7 Some Things Companies Do”). They would sell some of the investments for £100 (the NAV) and buy back shares for £80 leaving £20 of profit in the fund on each share bought back which over time should reduce the discount. If the shares trade at a 20% premium to NAV then they might do a new issue of shares, issuing shares at £120 and then using the money to buy the underlying investments for £100 which over time should reduce the premium.
This is starting to get complicated but just realise that ITs can trade at premiums or discounts to NAV. Large premiums to NAV need to be viewed with caution as eventually the share price should reflect the NAV and will come off since why would you pay £120 for something that’s only worth £100 (there are reasons!)?
Continuation Votes
The final thing to mention is something called continuation votes. Some trusts will periodically, say every 5 years, hold a vote on whether to continue. If enough shareholders vote to discontinue then the trust will be wound up with all the investments being sold and the money returned to shareholders. Shareholders might vote to discontinue if the IT has been trading at a large discount for a long period of time, say an £80 share price versus a £100 NAV. If the trust is wound up then the shareholders will get £100 per share, the value of the assets they own, which is better than the £80 they can get if they sell their shares on the stock exchange.
FUNDS – BUYING & SELLING
We forgot to mention this last month but if you want to buy units in a UT then normally you can only do so once a day. Once a day the fund manager will: revalue all the investments in the fund and work out the Unit Price (NAV per unit); sell new units at the unit price to new investors; and buy back units at the unit price from investors who want to sell units. Some UTs do in fact operate more pricing points than once a day but in general it’s only once.
For ETFs and ITs this is not the case, their shares trade on a stock exchange and you can buy and sell shares during opening hours of the stock exchange, second by second, so they are traded continuously not once per day.
FUNDS – SUMMARY
As you can see, the world of funds is very complicated and believe it or not we’ve tried to simplify things in these last couple of posts. If you do some research you may find that things are not exactly as we’ve laid them out as we have oversimplified some areas. The important thing to remember is that we don’t need to be experts, we just need a solid understanding so that we have confidence in what we’re doing.
In summary, a fund is just a pool of money from lots of investors and the fund manager goes off and invests the money on their behalf. Funds allow us to easily diversify as we can just buy units or shares in one fund and it can own dozens and dozens of companies and investments which saves us the hassle of doing it ourselves. There are three types of fund that we’re interested in and they are Unit Trusts / Mutual Funds, Exchange Traded Funds and Investment Trusts.
THE INVESTMENT REPORT
For an explanation of The Investment Report and The Crazy Fund please see our post “1.1 The Deep End”
| Mon 31-Mar-25 | Monthly Plan | Lumpsum Plan |
| Cash last month £ | 107 | 0 |
| Cash Saved £ | 50 | 0 |
| Unit buys / sells £ | 0 | 0 |
| Total Cash £ | 157 | 0 |
| Units last month | 483 | 10,000 |
| Units bought / sold | 0 | 0 |
| Total Units owned | 483 | 10,000 |
| Unit Price £ | 1.1221 | 1.1221 |
| Fund Value £ | 542 | 11,221 |
| Total Wealth £ | 699 | 11,221 |
| FX Rate | 1.2929 | 1.2929 |
| Total Wealth $ | 904 | 14,508 |
| Estimated CAGR | 14.33% | 14.33% |
| Years to $1billion | 91yrs 11mths | 83yrs 2mths |
Another month, another £50 saved on the Monthly Plan and the Lumpsum Plan is just letting time tick by.
THE CRAZY FUND
| Results | 28-Feb-25 | 31-Mar-25 | MTD Move | YTD Move | LTD Move |
| Unit Price £ | 1.2494 | 1.1221 | (10.19%) | (12.31%) | 12.21% |
| FX Rate | 1.2588 | 1.2929 | 2.71% | 3.32% | 1.62% |
| Unit Price $ | 1.5727 | 1.4508 | (7.76%) | (9.41%) | 14.03% |
| CAGR £ | 21.09% | 9.67% | (11.42%) | (18.23%) | 9.67% |
Last month we said “It was a bad month for our investments and this will happen, we’ll see far worse than this on our journey” and guess what? This month has been far worse. We lost (7.76%) in USD over the month and again, things could get even worse from here. In the course of our 80 – 120 year journey this is just noise and we’re still on track. We’ll see good times like last year and bad times like now but over the course of history the path has historically been up with a 10% CAGR.
Speaking of CAGR, it has collapsed this month and since we started our CAGR is now 9.67% on our investments. This has pulled down our projected CAGR to 14.33% and so the time it will take to make $1billion has spiked up by around 3½ years on both plans as seen by the green line on the chart. Our projected CAGR is slower to respond to our actual CAGR on purpose as we want to reduce the noise. CAGR is one of the most important parts of our plan and in post “1.3 CAGR & Crazy Plans” we saw the impact it has on our projected wealth over the next 120 years in the table of wealth for CAGRs of 10%, 15% and 20%.
Below is a table of what the fund is invested in at 31/March:
| Ticker | % Fund | Price | CCY | Type | Description |
| LON:IEM | 10.3% | 349.50 | GBP | IT | Impax Environmental Markets PLC |
| LON:SMT | 10.5% | 943.40 | GBP | IT | Scottish Mortgage Investment Trust PLC |
| LON:XDEM | 10.7% | 5,117.00 | GBP | ETF | DB X-Trackers MSCI World Momentum Factor UCITS |
| LON:ATT | 9.4% | 350.50 | GBP | IT | Allianz Technology Trust PLC |
| LON:IITU | 9.8% | 2,252.00 | GBP | ETF | iShares S&P 500 Information Technology |
| LON:PCT | 9.3% | 287.50 | GBP | IT | Polar Capital Technology Trust PLC |
| LON:XDWT | 9.6% | 82.37 | USD | ETF | Xtrackers MSCI World Information Technology UCITS |
| LON:CSP1 | 10.4% | 45,729.00 | GBP | ETF | iShares Core S&P 500 UCITS (Acc) GBP Hedged |
| LON:EQQQ | 9.9% | 36,062.00 | GBP | ETF | Invesco NASDAQ 100 UCITS GBP Hedged |
| LON:JAM | 10.0% | 981.00 | GBP | IT | JP Morgan American Investment Trust PLC |
| Shares | 99.9% | ||||
| Cash | 0.1% |
One of our holdings, EQQQ, went ex-dividend and paid out in the month so our cash balance has increased very slightly. Slowly, over time, dividends roll in and add to our return and when we re-invest them in the future they will power our CAGR.
A FAVOUR
*** Please Subscribe!
If you find our posts helpful in building a bright financial future then in exchange, please sign up to receive them by email. The more people that subscribe the more we grow which means we can create more content to help you become unimaginably wealthy. You can sign up using the subscribe box at the top of our website: https://thecrazyplan.com
*** Please Spread The Word!
This blog is free as we want everyone to have access to financial education. We hope to inspire you to set out on your own journey to a bright financial future and if we do, in return please spread the word to others.
NEXT MONTH
Next month we’re going to discuss risk. It’s been a turbulent start to the year on stock markets and so we want to have a think about what risk is as it might not be what you think.
Please don’t forget to subscribe and spread the word!
DISCLAIMER
Please note that by the time this blog is published, we may no longer own some or any of the investments discussed. Strategies and investments discussed might be totally unsuitable for you and we are not recommending them to you, they should only be considered as ideas for further research. You must read and agree to our Terms & Conditions, including the Disclaimer, which can be found on the T&C page of our website: https://thecrazyplan.com
© TradeFloor Promotions Limited 2025
