September 2024
WELCOME
Welcome to The Crazy Plan where our mission is to show that anyone can create unimaginable wealth.
Each month, we publish a blog providing readers with the financial education needed to set out on their own journey to a bright financial future. We do this by following two plans, our Monthly Plan saves £50 a month for 10 years and our Lumpsum Plan starts with a one-off £10,000. Our aim is to turn each plan into $1 billion in one or two generations.
At first, making $1 billion seems crazy but once you realise it’s a journey then things change. We’ll save our first £50 and from there our wealth will build to $1,000, then $5,000, then $10,000 and then $50,000. One day, if we’re patient, we’ll have $100,000 and then we’ll be looking at $1 million. From there it will be onwards to our $1 billion goal. This journey of small steps is how what seems impossible becomes possible.
You can dig-in to our posts however you like or if you are completely new to investing, you may want to start with “1.0 Liftoff!” and go through them in order which is how we build the education. We hope to provide you with the knowledge needed to set out on your own journey to a bright financial future if you choose. You can also visit the “About” page on our website to learn more about our plan.
All readers must read and agree to our Terms & Conditions, including the Disclaimer, which can be found on the T&C page of our website: https://thecrazyplan.com
ON WITH THE PLAN!
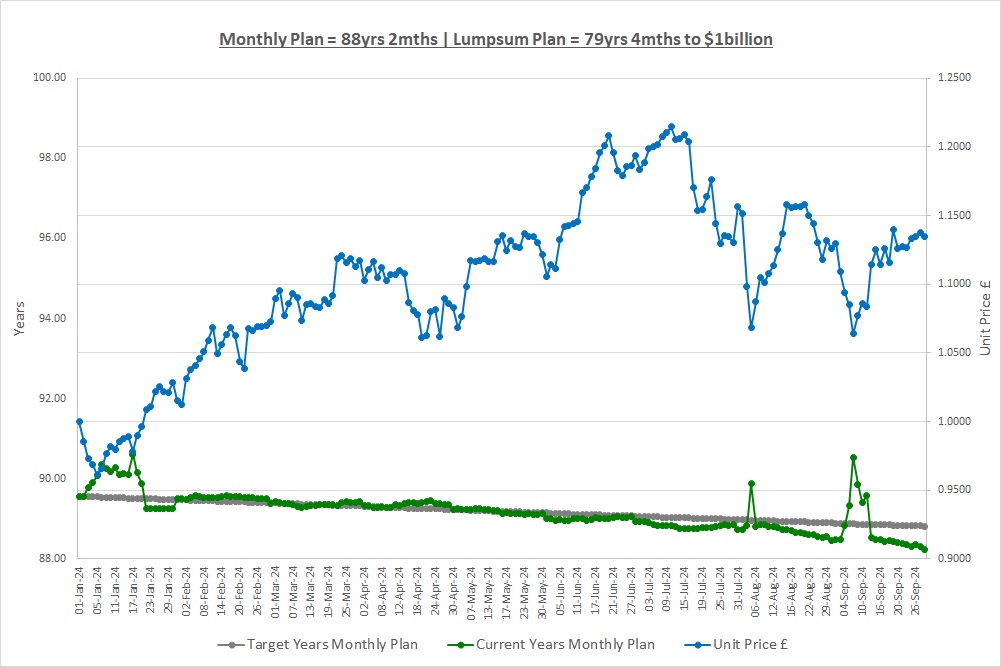
Time to $1billion: Monthly Plan 88yrs 2mths | Lumpsum Plan 79yrs 4mths
Last month we looked at correlation which is when the movement in something (ice cream sales) is linked to the movement in something else (the temperature). We then talked about investing small amounts of money when you can’t afford to buy shares in the stocks you want. We explored various options including giving up, waiting until we save enough, using correlation to pick a share we can afford, buying shares in only the stocks we can afford and fractional shares.
We’re now ready to start to think about the nitty-gritty of how to choose which shares to invest in and so this month we’re going to look at company accounts. These will give us the financial information we need to help us choose which shares to buy. We realise this post could put some readers off as it gets a little complicated but stick with it, the most important thing is to understand the big picture. Before we get stuck into accounts though we’re going to quickly revisit share splits.
SHARE SPLITS
A couple of months ago in post “1.7 Some Things Companies Do” we talked about share splits as a way a company can manage its share price. These don’t happen very often, in fact, hardly ever, but unbelievably one of The Crazy Fund investments did a share split this month.
At the close of business on 12/Sep LON:PCT did a 10 for 1 share split to reduce the share price to 1/10th of what it was. Last month the share price was 2,960p and now it’s 300p and for each share we used to own, we now own 10 shares. The share price has gone up over the month from 296p per new share to 300p per new share. Management felt £30 per share was unaffordable for some potential new shareholders so did the split.
ACCOUNTS
A couple of months ago we also mentioned something called Accounts which comprise of the Profit & Loss Account (“P&L”), the Balance Sheet and the Cash Flow Statement. So, what are Accounts? Well, they provide all the financial information about a company and are produced so shareholders are kept informed about how the company they own is doing. They’re usually produced once a year and a company therefore has a year-end date.
TINY COFFEE Co
We’ll try and keep our discussion as simple as possible and to do that we’ll revisit our little coffee shop from a few months ago. We’ll call it Tiny Coffee Co and say it has a year-end date of 31/Dec. We’ll assume the company was set up on 01/Jan/2024 and that the shareholders put in £100,000 of cash to start it. We’ll time travel to 31/Dec/2024 and look at its accounts for the year, so they cover the 12month period from 01/Jan/2024 to 31/Dec/2024. To make life easy we’ll say it: only sells coffee; bought some tables, chairs and a coffee machine; paid some rent; and paid some wages.
PROFIT & LOSS ACCOUNT
The P&L tells shareholders whether or not the business made a profit over the year. It shows the total Revenue (also called Sales) from selling cups of coffee and also all the Costs incurred in the year to make and sell them. If Tiny Coffee Co sold cups of coffee for more than they cost to make and sell, it will make a profit, if not it will make a loss.
There are a few types of costs and one type is Variable Costs. These costs increase and decrease directly with the number of cups of coffee sold and are the cost of the coffee beans, milk, water and sugar. If more cups of coffee are sold then more coffee beans are used for example. If we take the variable costs from the Revenue we get something called Gross Profit.
Then there are Fixed Costs which have to be paid and these don’t vary depending on how many cups of coffee are sold. The rent and wages are Fixed Costs as it doesn’t matter how many cups of coffee are sold, they stay the same.
There are also Capital Costs which are the cost of the tables, chairs and the coffee machine. These costs don’t happen every year as the items are still owned at the year-end and so they can be used in future years as well. Let’s say these items cost £50,000 and we expect them to last 5 years before they need replacing, it would be better to say the cost is £10,000 per year for 5 years. So, we match their cost to when they are used in the business. Capital Costs were therefore £10,000 for the year.
We can now work out Tiny Coffee Co’s profit for the year as (Revenue – Variable Costs – Fixed Costs – Capital Costs) and this is called the Operating Profit. Just stop and think about this for a moment, all we do is take all the money we received from Sales (the Revenue) and take off all the costs and that’s the profit from operating Tiny Coffee Co, simple.
If interest was earned on cash in the bank, or paid on a loan, we’ll add or take off this amount from the Operating Profit to get the final Profit Before Tax. Take off any tax the company has to pay and we end up with Profit After Tax and this is the amount that belongs to the shareholders.
Let’s assume that Tiny Coffee Co made a Profit Before Tax of £60,000 for the year and the tax it owes is £10,000 giving Profit After Tax of £50,000.
The final thing the P&L will show is something called Earnings Per Share or EPS for short. This is simply the Profit After Tax divided by the number of shares the company has in issue. If Tiny Coffee Co has 100,000 shares in issue then the EPS will be 50p (£50,000 Profit After Tax / 100,000 shares in issue). This means that as a shareholder, each share you own is entitled to 50p of profits.
We think we should open another coffee shop! No joke intended, this is how businesses grow and end up with thousands of outlets around the world making billions in profits.
CASH FLOW STATEMENT
The Cash Flow Statement tells us how the cash balance changed over the year. You might be wondering why this isn’t just the cash put in at the start of the year of £100,000 plus the Profit of £50,000 from the P&L above? If it was then we would have a cash estimate of £150,000 at the year-end. Well, this is the starting point but we need to make a few adjustments as some of the items in the P&L were not actually cash.
One adjustment is because we only put £10,000 of Capital Costs in the P&L as we spread the cost out over 5 years. We actually spent £50,000 of cash on them though and so we need to take off another £40,000 from the £150,000 cash estimate above. Our new cash estimate is therefore £110,000 at the year-end.
Another adjustment is because customers pay by card and just like we pay our credit card 1month late, card companies don’t pay businesses for a couple of months. If Revenue in November and December on cards was £50,000 then this won’t be received until after 31/Dec/2024, our year-end date. The P&L assumed all the sales were received as cash so we need to take off the money the card companies owe us from the £110,000 cash estimate above. Our new cash estimate is therefore £60,000 at year-end.
Let’s also say Tiny Coffee Co was offered a great deal on coffee beans and bought enough for the first 3months of next year, spending £5,000. The cost of coffee beans in the P&L was only for the year to 31/Dec/2024 so we need to take the extra £5,000 that was spent from the £60,000 cash estimate above. Our new cash estimate is therefore £55,000 at year-end.
The P&L also assumed Tiny Coffee Co paid the taxman but let’s say the tax isn’t due until next year. We need to add back the tax to the £55,000 cash estimate above as we haven’t paid it yet. Our cash balance is therefore £65,000 at year-end. At last, our cash balance!
Working out cash starts to become complicated as you can see. Cash is extremely important, it’s not enough to run a profitable business, you need to make sure you’re not running out of cash. Tiny Coffee Co has used cash in the year as it started the year with £100,000 and ended with only £65,000 and it’s the Cash Flow Statement that will show this.
BALANCE SHEET
The final piece of financial information the accounts show is what the company is worth on paper at the year-end. The easiest way to think of this is if we sold everything Tiny Coffee Co owns on 31/Dec/2024 and put all the cash into a suitcase, how much cash would there be in the suitcase?
Just like for us, a company owns things and also owes other people and businesses. The things it owns are called Assets and the things it owes are called Liabilities. In reality there are a lot more categories under each of these but we just need the big picture.
Tiny Coffee Co’s Assets at the year-end are: £40,000 of tables, chairs and the coffee machine (we said they will last 5 years so at the year-end there are 4 more years left at £10,000 per year); £50,000 of Revenue the card companies owe us; £5,000 of coffee beans sitting in the café which is called Stock; and £65,000 of cash in the bank from the Cash Flow Statement above. In total the Assets are £160,000.
Tiny Coffee Co’s Liabilities at the year-end are just the £10,000 it owes the taxman.
Therefore, if we sold everything for cash our suitcase would have £150,000 in it (Assets of £160,000 minus Liabilities of £10,000) and this is the value on paper of Tiny Coffee Co.
Finally, why is it called a Balance Sheet? Well, like a pair of scales the Balance Sheet must balance. It has to balance to the amount of money put into the business as it’s the money put in that created all the Assets and Liabilities. So, what’s been put into the business? Well, the shareholders put in £100,000 at the start and the retained profits for the year were £50,000. “Retained” means they have not been paid to shareholders as dividends which means they are still invested in the business. In total, £150,000 has therefore been put into the business and this is called the shareholder’s Capital and Reserves.
Luckily our Balance Sheet balances as the shareholder’s Capital and Reserves equals the Assets minus the Liabilities, phew!
THIS IS NOT 2 HOURS WORK!
The idea of accounts is really simple: a P&L to show if the company is selling goods for more than they cost; a Cash Flow Statement to show where the cash is going; and a Balance Sheet to show what the business owns and owes and is worth on paper. However, our Tiny Coffee Co example showed that it’s not so simple in practice and things can get really complicated. Starbucks 2023 Annual Report is 100 pages long and they “just” sell coffee!
How on earth are we supposed to read and understand all this in 2 hours, let alone read the accounts for dozens of companies? There are investment platforms we can use that summarise this information so we can see Sales, Costs, Profit, Assets, Liabilities etc quickly and clearly. We can then go to the company website to see the full Accounts if we’re interested (just search for “Starbucks Annual Report” for example) but even so, this really sounds like a lot of work.
We’ll let you into a little secret here, we’re not going to do any of this to start with. At the moment, The Crazy Fund isn’t invested in companies like Starbucks for that very reason, it will take too much time and it’s too complicated. The Crazy Fund is invested in other things and we’ll talk about those soon in another post.
So why do a whole post on Accounts if we’re not going to use them at the moment? Well, it’s extremely important to know about Accounts as it reminds us that we’re not gambling with our money, we’re investing in real businesses that sell real things day in, day out, like coffee. We can go to the Annual Report & Accounts and see how much coffee they’re selling and it’s staggering, for 2023 Starbuck’s Revenue was $36billion and its Profit After Tax was $4.1billion. What’s even more remarkable is that they started out as one Tiny Coffee Co.
As we’ve said before, investing is about owning a part of these businesses and sharing in the profits. If you want to go off and read dozens of sets of company accounts then you should, Warren Buffett spends all day reading accounts and he’s worth $120billion if you remember so it’s not a bad thing to do! We’re going to take another route to start with though to make our life easier and it should also only take a couple of hours a week, we like the hourly rate of $107,158 per hour!
THE INVESTMENT REPORT
For an explanation of The Investment Report and The Crazy Fund please see our post “1.1 The Deep End”
| Mon 30-Sep-24 | Monthly Plan | Lumpsum Plan |
| Cash last month £ | 100 | 0 |
| Cash Saved £ | 50 | 0 |
| Unit buys / sells £ | 0 | 0 |
| Total Cash £ | 150 | 0 |
| Units last month | 252 | 10,000 |
| Units bought / sold | 0 | 0 |
| Total Units owned | 252 | 10,000 |
| Unit Price £ | 1.1344 | 1.1344 |
| Fund Value £ | 286 | 11,344 |
| Total Wealth £ | 436 | 11,344 |
| FX Rate | 1.3383 | 1.3383 |
| Total Wealth $ | 584 | 15,182 |
| Estimated CAGR | 15.00% | 15.00% |
| Years to $1billion | 88yrs 2mths | 79yrs 4mths |
We don’t mention the Lumpsum Plan much because there isn’t much to say. We’re doing nothing apart from a couple of hours of research a week but we’re slowly making money. This shows how patience will be one of the most important reasons for our success. Don’t get caught up in the drama of the market or the latest meme stock, have a long-term plan, execute it and be patient.
THE CRAZY FUND
| Result | 30-Aug-24 | 30-Sep-24 | Move |
| Unit Price £ | 1.1261 | 1.1344 | 0.74% |
| FX Rate | 1.3166 | 1.3383 | 1.65% |
| Unit Price $ | 1.4826 | 1.5182 | 2.40% |
| CAGR £ | 19.54% | 18.31% | (1.24%) |
We made a small amount on our investments this month and again, the FX rate to see how much we’re worth in USD moved in our favour so we made 2.4% in USD over the month.
Again, the green line (the time to reach $1billion on the Monthly Plan) spiked as the unit price of The Crazy Fund came off in the middle of the month and we used a lower projected CAGR estimate. Investing is noisy and we just need to ride out the ups and downs and stick to the plan.
Below is a table of what the fund is invested in at 30/Sep:
| Ticker | % Fund | Price | CCY | Type | Description |
| LON:IEM | 7.3% | 393.50 | GBP | IT | Impax Environmental Markets PLC |
| LON:SMT | 8.6% | 837.00 | GBP | IT | Scottish Mortgage Investment Trust PLC |
| LON:XDEM | 10.8% | 5,009.50 | GBP | ETF | DB X-Trackers MSCI World Momentum Factor UCITS |
| LON:ATT | 10.1% | 352.00 | GBP | IT | Allianz Technology Trust PLC |
| LON:IITU | 9.1% | 2,391.50 | GBP | ETF | iShares S&P 500 Information Technology |
| LON:PCT | 8.6% | 300.00 | GBP | IT | Polar Capital Technology Trust PLC |
| LON:XDWT | 11.7% | 90.71 | USD | ETF | Xtrackers MSCI World Information Technology UCITS |
| LON:CSP1 | 10.7% | 45,258.00 | GBP | ETF | iShares Core S&P 500 UCITS (Acc) GBP Hedged |
| LON:EQQQ | 11.5% | 36,506.50 | GBP | ETF | Invesco NASDAQ 100 UCITS GBP Hedged |
| LON:JAM | 11.3% | 971.00 | GBP | IT | JP Morgan American Investment Trust PLC |
| Shares | 99.8% | ||||
| Cash | 0.2% |
LON:EQQQ went Ex-Dividend in the month and the Payment Date was also in the month so we’ve received the dividend in cash.
*** Please Subscribe!
If you find our posts helpful in building a bright financial future then in exchange, please sign up to receive them by email. The more people that subscribe the more we grow which means we can create more content to help you become unimaginably wealthy. You can sign up using the subscribe box at the top of our website: https://thecrazyplan.com
*** Please Spread The Word!
This blog is free as we want everyone to have access to financial education. We hope to inspire you to set out on your own journey to a bright financial future and if we do, in return please spread the word to others.
NEXT MONTH
Next month we’re going to try to come up with a plan for choosing what stocks to invest in now that we know where to get all the financial information we need. We need to come up with a way to filter out the good companies from the bad and we’ll have a look at a few different approaches.
DISCLAIMER
Please note that by the time this blog is published, we may no longer own some or any of the investments discussed. Strategies and investments discussed might be totally unsuitable for you and we are not recommending them to you, they should only be considered as ideas for further research. You must read and agree to our Terms & Conditions, including the Disclaimer, which can be found on the T&C page of our website https://thecrazyplan.com
© TradeFloor Promotions Limited 2024
