January 2024
WELCOME
Welcome to The Crazy Plan where our mission is to show that anyone can create unimaginable wealth.
Each month, we publish a blog providing readers with the financial education needed to set out on their own journey to a bright financial future. We do this by following two plans, our Monthly Plan saves £50 a month for 10 years and our Lumpsum Plan starts with a one-off £10,000. Our aim is to turn each plan into $1 billion in one or two generations.
At first, making $1 billion seems crazy but once you realise it’s a journey then things change. We’ll save our first £50 and from there our wealth will build to $1,000, then $5,000, then $10,000 and then $50,000. One day, if we’re patient, we’ll have $100,000 and then we’ll be looking at $1 million. From there it will be onwards to our $1 billion goal. This journey of small steps is how what seems impossible becomes possible.
You can dig-in to our posts however you like or if you are completely new to investing, you may want to start with “1.0 Liftoff!” and go through them in order which is how we build the education. We hope to provide you with the knowledge needed to set out on your own journey to a bright financial future if you choose. You can also visit the “About” page on our website to learn more about our plan.
All readers must read and agree to our Terms & Conditions, including the Disclaimer, which can be found on the T&C page of our website: https://thecrazyplan.com
ON WITH THE PLAN!
Time to $1billion: Monthly Plan 89yrs 5mths | Lumpsum Plan 80yrs 6mths
This month we’re going in at the deep end as we’re going to look at our first investment report. If you find this a tough post please stick with it, we’ll explain what it all means over the coming months. If you remember, we have two plans and we’re going to turn them both into $1billion. We have a Monthly Plan saving £50 a month and a Lumpsum Plan starting with £10,000.
FUNDS
To get started we need to talk about something called a fund. A fund is just a pool of money from lots of different investors. Someone called the Fund Manager then goes off and invests all the money on behalf of the investors. We put our money into a fund by buying something called a “unit” and the price of a unit is simply the value of the fund divided by all the units the Fund Manager has sold. Let’s look at an example.
We want to invest our Lumpsum of £10,000 so we set up our own fund and make ourselves the Fund Manager. We set the unit price to be £1 so our Lumpsum Plan buys 10,000 units (£10,000 cash / £1 unit price). The fund then goes off and spends all the money, investing in 10 companies.
One month later, the share prices of those 10 companies have moved around and let’s say they are up 2% overall, so the fund value is now £10,200. There are 10,000 units owned by investors (no one else invested in the fund when we set it up so it’s just us!) so at the end of the month the unit price is now £1.02 (£10,200 fund value / 10,000 units).
If we wanted to invest another £10,000 in the fund we could now only buy 9,803 units (£10,000 / £1.02 unit price). Units are more expensive as the investments have gone up in value so we get fewer units for the same amount of money.
We are going to leave it there for funds for now, just try and get the big picture. A fund is a pool of money and the unit price of the fund moves around as the value of the investments in the fund move around.
THE INVESTMENT REPORT
So, what is an investment report? Well, it simply tells you how your investments are doing and gives you some information about them. We have set up our own fund called The Crazy Fund to keep track of our investments (we have not legally set up a fund, we have just done it on paper). Let’s get stuck straight in:
| Wed 31-Jan-24 | Monthly Plan | Lumpsum Plan |
| Cash last month £ | 0 | 0 |
| Cash Saved £ | 50 | 10,000 |
| Unit buys / sells £ | 0 | (10,000) |
| Total Cash £ | 50 | 0 |
| Units last month | 0 | 0 |
| Units bought / sold | 0 | 10,000 |
| Total Units owned | 0 | 10,000 |
| Unit Price £ | 1.0156 | 1.0156 |
| Fund Value £ | 0 | 10,156 |
| Total Wealth £ | 50 | 10,156 |
| FX Rate | 1.2696 | 1.2696 |
| Total Wealth $ | 63 | 12,894 |
| Estimated CAGR | 15.00% | 15.00% |
| Years to $1billion | 89yrs 5mths | 80yrs 6mths |
MONTHLY PLAN
We saved £50 this month and didn’t buy any units in The Crazy Fund so we ended the month with Total Cash of £50 which is our Total Wealth. Now we want to know how much we are worth in $ as we are trying to make $1billion. Just like if we go on holiday abroad, we need to know how many $ we can buy for £1. At the end of January that was £1 = $1.2696 and so our £50 will buy us $63. This is our Total Wealth in $. We have then assumed we can make a return of 15% a year (called a CAGR) so it will take 89yrs 5mths to make $1billion. We know, that’s quite a long time but we have to start somewhere!
LUMPSUM PLAN
We put in £10,000 at the beginning of the month and spent it all buying 10,000 units in the Crazy Fund at £1 each, so we ended the month with no cash. The unit price of The Crazy Fund at the end of the month was £1.0156 so our investment is worth £10,156 (10,000 units * £1.0156 unit price). Our Total Wealth is equal to our cash plus the value of our investment in The Crazy Fund, so £10,156 as we spent all our cash on units. With the exchange rate of $1.2696 we’re therefore worth $12,894. Again, we have assumed we can make a CAGR of 15% so it will take 80yrs 6mths to make $1billion. We know, this is also a long time!
QUESTIONS
Now, we expect you have a lot of questions and over the coming months we hope to answer them. At this stage though, just try and get the big picture. We have put our money into a fund by buying something called units. The fund invested all the money in 10 investments and the prices of those investments moved around. At the end of the month our initial investment of £10,000 is now worth £10,156.
One extremely important thing to notice is that saving just £50 a month for 10 years means it only takes around 9 years longer to make $1billion than starting with £10,000 now! That’s quite simply staggering and it shows how you don’t need to be rich to become very wealthy, you just need to start. We cannot emphasise this enough, we just need to start, no matter how small, and we will become billionaires.
One burning question we expect you have is “great, but what have you invested in that’s gone from a unit price of £1 to £1.0156 over the month?” Read on, we’ll now go over The Crazy Fund.
THE CRAZY FUND
The Crazy Fund sold 10,000 units for £10,000 to our Lumpsum Plan at the beginning of the month. What did it do with this money? Let’s look at what it owns at 31/January:
| Ticker | % Fund | Price | CCY | Type | Description |
| LON:IEM | 7.90% | 379.50 | GBP | IT | Impax Environmental Markets PLC |
| LON:SMT | 8.89% | 773.80 | GBP | IT | Scottish Mortgage Investment Trust PLC |
| LON:XDEM | 10.34% | 4,304.00 | GBP | ETF | DB X-Trackers MSCI World Momentum Factor UCITS |
| LON:ATT | 10.26% | 319.00 | GBP | IT | Allianz Technology Trust PLC |
| LON:PCT | 8.58% | 2,685.00 | GBP | IT | Polar Capital Technology Trust PLC |
| LON:XDWT | 11.41% | 74.91 | USD | ETF | Xtrackers MSCI World Information Technology UCITS |
| LON:MTE | 8.68% | 130.20 | GBP | IT | Montanaro European Smaller Companies Trust PLC |
| LON:CSP1 | 10.63% | 40,304.00 | GBP | ETF | iShares Core S&P 500 UCITS (Acc) GBP Hedged |
| LON:EQQQ | 11.66% | 33,151.50 | GBP | ETF | Invesco NASDAQ 100 UCITS GBP Hedged |
| LON:JAM | 11.66% | 894.00 | GBP | IT | JP Morgan American Investment Trust PLC |
| Shares | 100.00% | ||||
| Cash | 0.00% |
The Crazy Fund bought 10 investments on 02/January. Each investment has a simple code to identify it called a “Ticker”. For example, the “IEM” part of the ticker is the key for Impax Environmental Markets PLC. The “LON” tells you that it is listed on the London Stock Exchange. Annoyingly, sometimes it will be written LON:IEM, sometimes as IEM.L, sometimes in another way, we just have to live with these different formats.
You can go online to any finance website like Google Finance, Yahoo Finance, Investing, London Stock Exchange, etc and type in “IEM” and you’ll be able to find a price chart and information about it. You can do a search and go to the website of IEM as well if you like to find out more information.
At the end of the month, The Crazy Fund was 100% invested and had no cash. Our biggest investments were EQQQ and JAM which each had 11.66% of our money in them. Our smallest investment was IEM which had 7.90% of our money in it. Why do all the investments not have an equal amount invested in them?
One reason is that when we bought each investment we chose to put slightly different amounts into each of them, we were aiming for around 10% in each but were not too worried about small differences. Another reason is that since we bought the investments their prices have moved around over the month. XDWT has gone up over 6% and so is now a larger % of the fund, IEM went down over 3% and so is a smaller % of the fund.
Don’t worry too much about the CCY for now, all of our investments are priced in £ apart from XDWT which is in $. Just get used to the fact that there will be different currencies floating around.
So, what have we bought? Some of our investments are “ITs” which stands for Investment Trusts and some are “ETFs” which stands for Exchange Traded Funds. Again, for now, don’t worry about what that means just start getting used to the language and in future posts we’ll discuss all these different investment types. The bottom line is that we have started, we have bought some investments and are off on our 89year journey.
UPS AND DOWNS
The blue line in the following chart uses the left scale and shows the unit price of The Crazy Fund in £ during January. As you can see, it was not a smooth ride like a bank account! We immediately lost money, almost 4% of our £10,000 and we didn’t recover for almost 3 weeks. Don’t think of this as risk, this is just volatility or noise. We will talk about risk later in another post but for now, just get used to the fact that stock markets go up and down a lot.
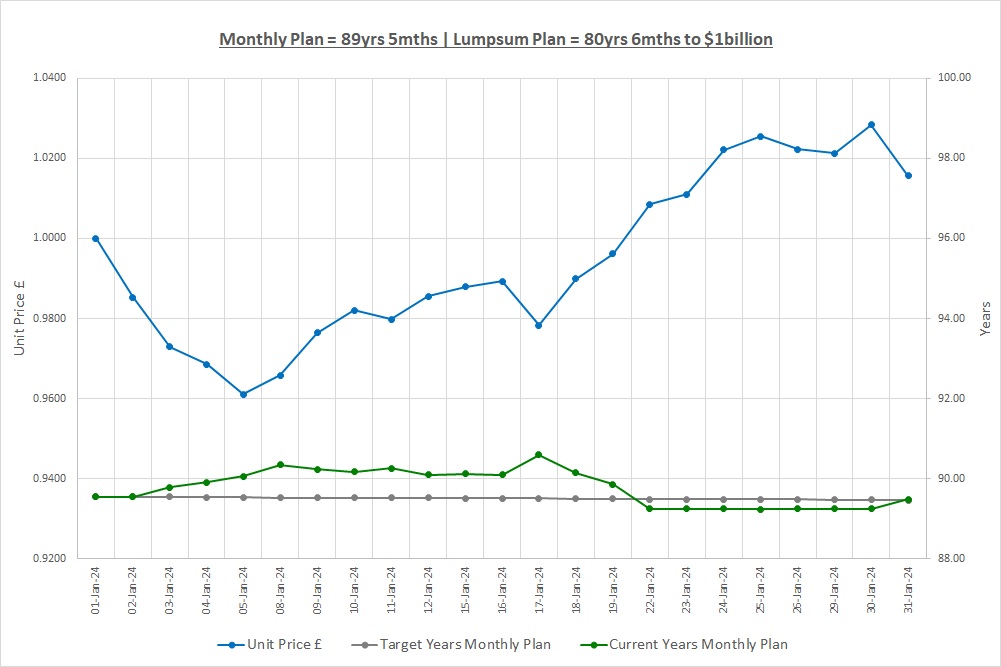
On the right scale are the grey and green lines. The grey line shows what our target time to $1billion is and the green line shows what it is actually turning out to be. The green line moves around as we make or lose money and it also moves around as the £ / $ exchange rate moves as we need to convert our £ into $ to see if we are billionaires. Not this month by the looks of things!
*** Please Subscribe!
If you find our posts helpful in building a bright financial future then in exchange, please sign up to receive them by email. The more people that subscribe the more we grow which means we can create more content to help you become unimaginably wealthy. You can sign up using the subscribe box at the top of our website: https://thecrazyplan.com
*** Please Spread The Word!
This blog is free as we want everyone to have access to financial education. We hope to inspire you to set out on your own journey to a bright financial future and if we do, in return please spread the word to others.
NEXT MONTH
In our next post we’re going to take a step back from the world of investing and talk about one of the most important things that will lead to us achieving our goal, sacrifice. Please join us for the next step on our journey to $1billion.
If you want to follow us on our journey then please subscribe to our alerts at the top of this site. We hope we will inspire you to set out on your own journey to create a better financial future for you and your family. We are not dreaming, it will happen, we have a plan, do you?
DISCLAIMER
Please note that by the time this blog is published, we may no longer own some or any of the investments discussed. Strategies and investments discussed might be totally unsuitable for you and we are not recommending them to you, they should only be considered as ideas for further research. You must read and agree to our Terms & Conditions, including the Disclaimer, which can be found on the T&C page of our website https://thecrazyplan.com
© TradeFloor Promotions Limited 2024
